Download
1 / 1
10 likes | 191 Vues
Identification of possible new sources of Sclerotinia blight resistance in the U.S. Peanut Mini Core Collection using a molecular marker associated with resistance to Sclerotinia minor Jagger K.D. Chamberlin * , H.A. Melouk, USDA-ARS, Wheat, Peanut and other Field Crops Research Unit,

E N D
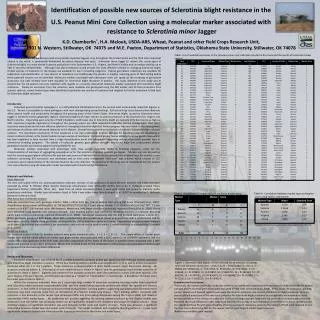
Identification of possible new sources of Sclerotinia blight resistance in the U.S. Peanut MiniCore Collection using a molecular marker associated with resistance to Sclerotinia minor Jagger K.D. Chamberlin*, H.A. Melouk, USDA-ARS, Wheat, Peanut and other Field Crops Research Unit, 1301 N. Western, Stillwater, OK 74075 and M.E. Payton, Department of Statistics, Oklahoma State University, Stillwater, OK 74078 Abstract Cultivated peanut, the second most economically important legume crop throughout the United States and the third most important oilseed in the world, is consistently threatened by various diseases and pests. Sclerotinia minor Jagger (S. minor), the causal agent of Sclerotinia blight, is a major threat to peanut production in the Southwestern U.S., Virginia, and North Carolina and can reduce yield by up to 50% in severely infested fields. Although host plant resistance would provide the most effective solution to managing Sclerotinia blight, limited sources of resistance to the disease are available for use in breeding programs. Peanut germplasm collections are available for exploration and identification of new sources of resistance, but traditionally the process is lengthy, requiring years of field testing before those potential sources can be identified. Molecular markers associated with phenotypic traits can speed up the screening of germplasm accessions, but until recently none were available for Sclerotinia blight resistance in peanut. This study objective of this study was to characterize the US peanut mini-core collection with regards to a recently discovered molecular marker associated with Sclerotinia blight resistance. Ninety-six accessions from the collection were available and genotyped using the SSR marker and 39 total accessions from spanish, valencia, runner market types were identified as potential new sources of resistance and targeted for further evaluation in field tests for Sclerotinia blight resistance. Table I. List of available accessions of the US peanut mini-core collection included in this study and the results of molecular marker analysis. 1 2 3 4 5 6 7 8 9 10 11 12 13 14 15 16 17 18 19 20 Table III. Correlation between market type and marker score using Tukey’s adjustment. Introduction Cultivated peanut (Arachis hypogaea L.) is a self-pollinated allotetraploid and is the second most economically important legume in the U.S. Peanut is susceptible to many pathogens, with most damage being caused by fungi. Soil-borne fungi cause diseases that adversely affect peanut health and productivity throughout the growing areas of the United States. Sclerotinia blight, caused by Sclerotinia minor Jagger, is limited to certain geographic regions. Sclerotinia blight is of major concern to peanut producers in the Southwest US, Virginia and North Carolina. Depending upon severity of field infestation, yield losses due to Sclerotinia blight are typically 10 % but may be as high as 50%. Expensive fungicide applications throughout the growing season are often required for effective disease management. Host plant resistance would provide the most effective solution to managing Sclerotinia blight but limited progress has been made in the development and release of cultivars with enhanced tolerance to the disease. Several factors contribute to the lack of available Sclerotinia blight resistant cultivars. The inheritance mechanism of host resistance is not well understood. Another obstacle for breeding programs developing S. minor resistant cultivars is the limited number known sources of resistance. Cultivated peanut has an extremely narrow genetic base which has been explained to have resulted from a single domestication event and subsequent inbreeding among a few select parental lines in commercial breeding programs. The advent of molecular genetics gave peanut breeders new-found hope that undiscovered diverse germplasm would soon become apparent and available for use. Molecular markers associated with phenotypic traits have proven extremely useful in breeding programs, either for the characterization of members of segregating populations or for the selection of desired parental genotypes. Markers can also be used as tools for screening germplasm collections for possible new sources of desired traits to be incorporated into adapted lines. For peanut, a core collection containing 831 accessions was developed and an even more manageable “mini-core” was selected which consists of 112 accessions and is representative of the diversity found in the core collection. The objective of this study was to characterize the U.S. peanut mini-core collection using the molecular marker associated with Sclerotinia blight resistance. Figure 1. Genotypic data typical of that collected for all available US peanut mini-core collection accessions. Lanes: 1 & 20 = 50 bp ladder, 2 = Okrun, 3 = ARSOK-R1 (TX994313), 4 = PI 471952, 5= PI 471954 , 6 = PI 476432, 7 = PI 476636 , 8 = PI 478819, 9 = PI 478850, 10 = PI 481795, 11 = PI 482120, 12 = PI 482189, 13 = PI 494795, 14 = PI 496401, 15 = PI 496448, 16 = PI 502040, 17 = PI 502111, 18 = PI 502120, 19 = PI 504614. †Numbers followed by the same letters are not significantly different Materials and Methods Plant Materials The mini core subset of the U.S. peanut germplasm collection consists of 112 accessions of which 96 were available and viable and were provided by either R. Pittman (Plant Genetic Resources Conservation Unit, USDA-ARS, Griffin, GA) or by C. Holbrook (Coastal Plains Experiment Station, USDA-ARS, Tifton, GA). Seed from all viable accessions (Table I) were germinated and grown to maturity under greenhouse conditions. Market type information listed in Table II was either taken from Kottapalli et al. (2007) or provided by C. Holbrook (personal communication). DNA Extraction and Marker Analysis DNA was extracted from each genotype listed in Table I, either from dry, mature seed or from young leaf tissue (Chenault et al., 2007). Amplification using primer pPGPseq2E6L (5’ TACAGCATTGCCTTCTGGTG 3’) and primer Marker 3 (5’ GCACACCATGGCTCAGTTATT 3’) was carried out in a PTC-100 thermal cycler (MJ Research, Watertown, MA) under conditions previously reported (Chenault et al., 2008). Bands were identified using Quantity One software (Biorad). Each banding pattern was verified by repeating reactions in triplicate. Resulting bands were scored as previously reported (Chenault et al., 2008). Genotypes possessing only the 145 bp band were given a score of L. When genotypes possessed both bands, those with a predominant 145 bp band were scored as B and those with a predominant 100 bp band were scored b. Finally, those genotypes carrying only the 100 bp band were given an S rating. Virginia-type accessions were analyzed as all others, but marker data obtained is for observation only and can not be used to predict S. minor resistance or susceptibility (Chenault et al., 2008). Statistical Analysis For statistical analysis (Table III), banding patterns were given numerical value: L = 1, S = 2, B = 3. The simple effects of marker given market type and the simple effects of market type given marker were evaluated with a SLICE option in an LSMEANS statement, and if a simple effect was significant at the 0.05 level, pair-wise comparisons of the levels of the factor in question were conducted with a DIFF option and adjusted using Tukey's procedure. Means and standard errors for the combinations of the factors are presented and letters used to represent the observed significant differences. Table II. Breakdown of marker analysis results by market type. S L L L L S L L L L L L S L L L L Results and Discussion Successful amplification was achieved for all available accessions using the primer pair specific for the molecular marker associated with Sclerotinia blight resistance in peanut. Of the four banding patterns possible upon amplification (L, B, b, and S), all but 3 accessions produced either the L or the S pattern. Three accessions produced pattern B (both bands present, larger band more intense). No accession produced pattern b. Data typical of such amplifications is shown in Figure I and the genotyping result (marker score) for all accessions is listed in Table I. Eighteen (18) percent of the analyzed accessions were characterized as runner, 23% were Valencia, 27% were Virginia, 15% were Spanish, and 16% were described as a “mixed” or “intermediate” in market-type. A breakdown of marker score by market type is listed in Table II. Within the accessions evaluated, there are a surprisingly large number of accessions containing the large marker band associated with Sclerotinia blight resistance (approximately 60%), with the marker being especially predominant within the Spanish and Valencia accessions. In fact, 100% of all Spanish accessions tested produced the L banding pattern, supporting speculation that Sclerotinia minor resistance may have originally come from an introduction of a Spanish market-type peanut. The L banding pattern consistent with resistance is less dominant in the runner type accessions (35%) and more evenly distributed among the Virginia (46%) and mixed or intermediate (44%) market-types. No predictions are possible regarding the banding pattern produced by the Virginia market type accessions since the marker was previously shown not be significantly related to the resistance phenotype for Virginia cultivars. Upon statistical analysis, no significant correlation was seen between marker score and country of origin. There was, however, a significant relationship between market type and marker score (Table III). The marker consistent with resistance (banding pattern L = 1) was more significantly related to Spanish and Valencia market type accessions than to the runner and mixed types. Summary and Conclusions Previously, the marker used in this study was shown to be significantly associated with resistance to Sclerotinia blight in peanut cultivars and PIs that had been thoroughly evaluated in field trials (Chenault et al., 2008). In this study, 39 accessions spanning runner, Valencia and Spanish market-types were identified as potential new sources of Sclerotinia blight resistance. Since no reports of field evaluation of the mini-core collection for Sclerotinia blight resistance or susceptibility are available to aid in further validation of this marker as a selection tool for breeding programs, field trials are currently underway toward that end. However, the results obtained in this study have identified PIs worthy of such evaluation in the field for S. minor resistance and also identified those PIs with low probability of being a source of resistance, reducing the amount of field work required to test the mini-core collection by 34% for the runner, Valencia and Spanish market type accessions. [References available upon request]