Download
1 / 11
120 likes | 352 Vues
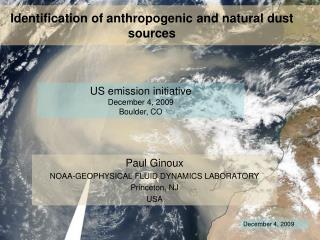
Paul Ginoux NOAA-GEOPHYSICAL FLUID DYNAMICS LABORATORY Princeton, NJ USA. Identification of anthropogenic and natural dust sources. US emission initiative December 4, 2009 Boulder, CO. December 4, 2009. Natural dust sources.

E N D
Paul Ginoux NOAA-GEOPHYSICAL FLUID DYNAMICS LABORATORY Princeton, NJ USA Identification of anthropogenic and natural dust sources US emission initiative December 4, 2009 Boulder, CO December 4, 2009
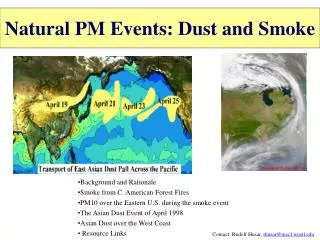
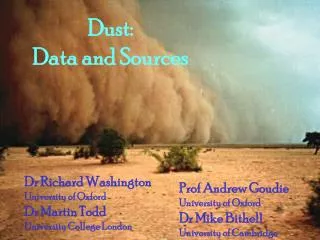
Natural dust sources bare and dry surfaces with fine soil texture (clay, silt or alluvium) = dry river, lake or sea bed Dust from dry river bed, Alaska Bodele depression, paleo-lake, Chad Dust from ephemeral lakes, Mauritania
Anthropogenic dust sources • Disturbed soil due to agriculture, overgrazing • Dry sea or lake bed by excessive irrigation • Construction, mining, etc. Dust from dry sea bed, Aral sea (Uzbekistan) Cattle herds, Chad Mining, Ohio valley
Identification of dust sources • Dust size:0.1 to 10 mm radius Angstrom exponent: a=-log(t1/t2)/log(l1/l2)<0.5 • Dust optical properties: • Absorb radiation in nUV and infrared • Weak absorption in visible • Single scattering albedo: w(l1)<w(l2)<w(l3) Dubovik et al., JAS, 2002
Using nUV TOMS satellite data for global natural dust source inventory Ginoux et al. (2001) global inventory of natural dust sources based on TOMS AI λ: 331 or 340 nm λ0:360 or 380 nm DUST: w(l)<w(l0) => TOMS AI > 0 if no clouds Dust source = maxima of distribution of Frequency Of Occurrence (FOO) TOMS AI > AIthresh Prospero et al. RG, 2002
Identification of anthropogenic and natural dust sources • Dust sources can be identified from satellite spectral data (Ginoux et al., 2009) • Single scattering albedo: mostly dust • Angstrom exponent: “freshly emitted dust” • There is no difference of optical properties between anthropogenic and natural dust. Need to rely on other dataset -> Land use (or land use change)
Using MODIS DB spectral properties to retrieve dust source Deep blue algorithm uses solar reflectance at 412, 470 and 670 nm to retrieve t, w, a Advantages: retrieve over bright surface, less sensitive to aerosol height that nUV technique, good resolution (~10km)
Overlapping sources with land use change There are anthropogenic dust sources in Sahel all the way South to the Guinea Gulf but plumes less frequent than Sahara and less intense.
Validation 1. Analyzing each source with independent datasets. At 10 km resolution, it is possible to use GoogleEarth to associate dust source with natural or anthropogenic features. 2. Using Dubovik et al. (JGR, 2008) adjoint model with assimilation of MODIS DEEP blue with constrain on Angstrom exponent and SSA(l) Dust and sea-salt sources retrieved using MODIS+GOCART (Dubovik et al., 2008)
Summary Dust optical properties have unique characteristics which can be used from satellite data to determine dust sources Natural dust sources: global inventory at 1x1o and 0.25x0.25ohttp://www.gfdl.noaa.gov/atmospheric-physics-and-chemistry_data Anthropogenic sources: • weaker than natural and less frequent than natural but significant and different locations. • Inventory 10x10 km. West Africa published. Global work in progress. Needs validation.