Download
1 / 6
60 likes | 229 Vues
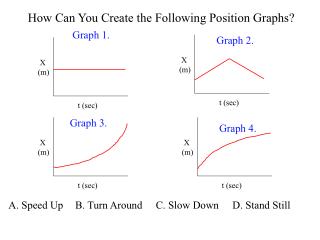
This educational overview explores position-time graphs, highlighting how different line types represent an object's motion. Straight lines indicate constant velocity, with slopes calculated by the formula (Y2-Y1)/(X2-X1). A curved line signifies changing velocity or acceleration, while a horizontal line means the object is at rest. This resource, featuring insights from experts Nicole Ross, Justin Garner, Matt Devine, Kevin Carney, and Naish Berran, serves as a foundation for analyzing motion in physics.

E N D
Position Time Graph(x-t) Nicole Ross, Justin Garner, Matt Devine, Kevin Carney, Naish Berran
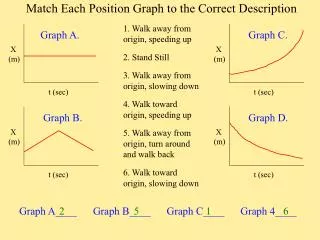
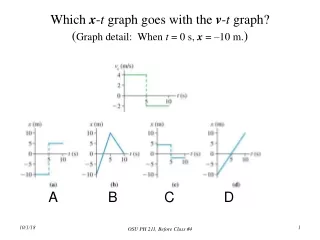
X axis - time (seconds) • Y axis - position (meters) • Curved line is changing velocity • Straight line is constant velocity • Velocity = Slope • Slope = Y2-Y1 / X2-X1
Graphs Straight line-constant velocity