Chapter 3 Cumulative Test
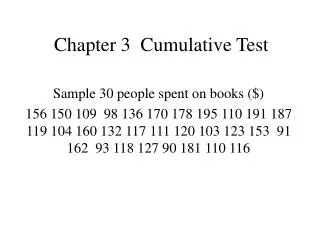
Chapter 3 Cumulative Test. Sample 30 people spent on books ($) 156 150 109 98 136 170 178 195 110 191 187 119 104 160 132 117 111 120 103 123 153 91 162 93 118 127 90 181 110 116. 1) qualitative or quantitative and level of measurement. Data is quantitative

Chapter 3 Cumulative Test
E N D
Presentation Transcript
Chapter 3 Cumulative Test Sample 30 people spent on books ($) 156 150 109 98 136 170 178 195 110 191 187 119 104 160 132 117 111 120 103 123 153 91 162 93 118 127 90 181 110 116
1) qualitative or quantitative and level of measurement • Data is quantitative • Data is ratio (there is a true 0)
2) Method of data collection. Sampling technique • Use a survey • Collect data using random sampling (randomly chosen people) • If data were systematic or convenience the sample might not be representative of the amount people spent on boods.
3. Make frequency distribution with 5 classes. Include class limits, midpoints, frequencies, boundaries, relative freq and cumulative freq.
Stem and leaf • 9 : 0138 • 10 : 349 • 11 : 0016789 • 12 : 037 • 13 : 26 • 14 : • 15 : 036 • 16 : 02 • 17 : 08 • 18 : 17 • 19 : 15
Mean median and mode • Mean= $133.67 • Median= $121.50 • Mode = $100.50 • These are statistics because they describe a sample
Range, variance and standard deviation • Range = $195 -90 = $105 • Variance = 1040.5 • standard deviation = $32.26 • The range is larger than 3 standard deviations.
Probability spending < $120 • Frequency estimate = 14/30= .467 • Prob randomly selecting person who spent more than $120. There are 15 such people in the sample. So Prob=0.5
Prob person spent < $120 or > $160 • These are mutually exclusive events (person cannot do both). So the probability is the sum of the probabilities of individual events which is 14/30 + 7/30 = 21/30 = .7
5 person sample. Prob (at least one spent > $175) • Pr(any person spent > $175) = 5/30 = .1667 • Pr(at least 1 person spent > $175) = 1 - Pr(no people spent > $175) • Assume samples are independent (i.e not from the 30 people sampled, which would be a dependent sample • Pr(one person > $175) = .8333 • Pr(1 or more) = 1 - .833^5 = .598 • If dependent then = 1 - 25*24*23*22*21/(30*29*28*27*26) = .627
How many ways can 5 respondents be resampled from 30? • Order is not important so it is number of combinations of 30 things taken 5 at a time • This is 142506