Download

1 / 15
150 likes | 231 Vues
This study examines the economic effects of government incentives on the ethanol fuel market, analyzing market determinants and evaluating the impact of subsidies on demand and supply dynamics. Data from 1988 to 2002 were collected to build econometric models for demand and supply. Results suggest significant implications for the industry with potential subsidy reductions. The findings highlight the industry's reliance on subsidies and the need for strategic shifts to adapt to changing regulations and market trends.

E N D
The Economic Effect of Governmental Incentives on the Ethanol Fuel Market Quinn Kelley Graduate Student University of Georgia
Problem Statement • Limited research available on the market for ethanol. • To determine the effectiveness of current subsidies for ethanol, the economic structure of the fuel-blending market for ethanol is required.
Objectives • Investigate the impact market determinants have on the ethanol market. • Develop an econometric model of the fuel-blending market demand and supply for ethanol. • Based on this econometric model, elasticities are calculated and implications for this highly subsidized market are discussed.
Alternative Fuel Legislation • Alternative Motor Fuels Act (AMFA) of 1988 • Clean Air Act Amendments (CAAA) of 1990 • Energy Policy Act (EPACT) of 1992 • Federal Ethanol Subsidy of $0.54 per gallon • Additional State Subsidies
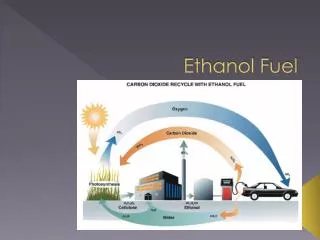
Ethanol • Ethanol is an alcohol-based, colorless liquid fuel with a characteristic odor. • Currently, ethanol is used as a fuel additive in gasoline. • In the U.S., corn is the predominant feedstock in ethanol production. • Ethanol is produced through a process of fermenting and distilling starch crops that have been converted into simple sugars.
Competition Methyl Tertiary-Butyl Ether (MTBE) • First synthesized in the early 1960s and commercial production began in 1979. • Classified as a volatile organic compound (VOC). • Produced by a chemical reaction between methanol and isobutylene.
Empirical ModelDemand QitD = β0 + β1Pwt + β2Pgt + β3Vit + β4CAAAit + Σ5j=1βj+4Rji + εitD Q = annual ethanol quantity sold Pw = lagged price wedge (Peth – Pmtbe) Pg = annual grade-weighted wholesale price of gasoline V = annual number of registered vehicles by state CAAA = Clean Air Act non-attainment dummy variable R = regional dummy variable
Empirical ModelSupply QitS = α0+ α1 Pwt + α2Pcit + α3Si + Σ5j=1αj+3Rji + εitS Pc = state-level annual corn price S = state-level annual subsidy
Data • Data were collected from the Economic Research Service, the U.S. Department of Transportation, the Energy Information Administration, and the U.S. Environmental Protection Agency. • The data set includes: 1988 to 2002 annual observations by state.
Tobit Two-Stage Least Squares Results *Significantly different from zero at the 5% significance level
Tobit Two-Stage Least Squares Results *Significantly different from zero at the 5% significance level
Market Implications • With fuel-marketing firms bearing the major impact of any ethanol subsidy removal (91%), any reduction in the subsidy will negatively impact ethanol’s competitiveness over MTBE. • A gradual phase-down of the subsidy will be dramatic for the industry. • A 45% reduction in the ethanol subsidy will result in the elimination of the ethanol market.
Impacts • If a state is designated in non-attainment, ethanol demand will increase by 14 million gallons. • An elastic input demand for corn limits any bargaining leverage corn producers have in their attempts to influence market price. • The increases in state ethanol subsidies over the last decade have not resulted in inducing a positive ethanol supply response.
Conclusions • The economic structure of the ethanol market indicates ethanol agents are addicted to the federal tax exemption on ethanol blended fuels. • The potential for demand expansion resides in structural shifts occurring from clean air and water regulations, health restrictions, renewable fuels, and global warming.