Download
1 / 27
270 likes | 295 Vues
SWTJC STEM – ENGR 1201. Quality Factors. Good modeling requires good data. To achieve this, the physical properties of a model must be measured and reported with quality . How do scientists and engineers express measurement quality?.

E N D
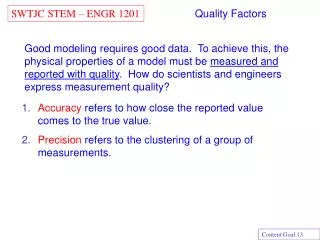
SWTJC STEM – ENGR 1201 Quality Factors Good modeling requires good data. To achieve this, the physical properties of a model must be measured and reported with quality. How do scientists and engineers express measurement quality? • Accuracy refers to how close the reported value comes to the true value. • Precision refers to the clustering of a group of measurements. Content Goal 13
SWTJC STEM – ENGR 1201 The accuracy of a measurement refers "to how close the reported value comes to the true value". Two common methods for expressing accuracy are Accuracy • Mathematical error, also called percent error. • Range of uncertainty, also called tolerance. Content Goal 13
SWTJC STEM – ENGR 1201 • Mathematical error is reported in three different ways: • Given: • reported value - the measured value • expected value - the theoretically correct or desired value • Then: • absolute error = reported value - expected value • relative error = absolute error / expected value • percent error = relative error · 100% Mathematical Error Content Goal 13
SWTJC STEM – ENGR 1201 Given: reported value = 122 mm expected value = 120 mm Then: a. absolute error = reported value - expected value absolute error = 122 mm – 120 mm = 2 mm Ans b. relative error = absolute error / expected valuerelative error = 2 mm / 120 mm = 0.017 AnsNote: relative error has no units. c. percent error = relative error · 100% percent error = 0.017 · 100% = 1.7 % Ans Mathematical Error Content Goal 13
SWTJC STEM – ENGR 1201 • The following are general classifications for errors: • For consumer purposes, 5-10% error is acceptable • For engineering purposes, 1% error is acceptable • For scientific purposes, 0.1% error is acceptable Classification of Error Content Goal 13
tolerance SWTJC STEM – ENGR 1201 Range of Uncertainty Range of uncertainty is reported as anominal valueplus orminus an amount called thetolerance.Reported value: 120 mm ±1 mm = 119 mm to 121 mm nominal value range of uncertainty Content Goal 13
nominal value tolerance SWTJC STEM – ENGR 1201 Range of Uncertainty Range of uncertainty is also reported as anominal valueplus ormin Range of uncertainty is reported as anominal valueplus orminus an amount called thetolerance us an percenttolerance. Reported value 120 mm ±2% = 117.6 mm to 122.4 mm Note: 2% of 120 = 2.4, 120 - 2.4 = 117.6, 120 +2.4 = 122.4 range of uncertainty Content Goal 13
SWTJC STEM – ENGR 1201 Informal Accuracy Reporting Actually, there is a third, less formal way of reporting accuracy. The digit representing the smallest value reported implies that the measurement is “accurate to that digit”. If it were not, then why report it? A reported value 14.02 m implies the measurement was accurate to the nearest 0.01m (a cm). A reported value 14.00 m also implies the measurement was accurate to the nearest 0.01m (a cm). Content Goal 13
SWTJC STEM – ENGR 1201 Precision Theprecisionof a measurement refers to " the clustering of a group of measurements and can be determined by calculating standard deviation, standard error, or confidence interval". Precision is usually expressed by the number ofsignificantdigitsreported for the magnitude of the measurement. 3significant digits is good; 5 significant digits is excellent. A weighing scale that reports 128 gramsis less precisethan one that reports 128.35 grams. Content Goal 13
SWTJC STEM – ENGR 1201 Precision Costs $’s Precision in measurement comes at a price! 3 significant digits, commercial quality – Costs $100 4 significant digits, industrial quality – Costs $500 5 significant digits, scientific quality - Costs $2500 Content Goal 13
SWTJC STEM – ENGR 1201 Precision – Target 1 Measurementprecisionmust be interpreted in light of measurementaccuracy. Let’s use a target practice example: Content Goal 13
SWTJC STEM – ENGR 1201 Precision – Target 2 Measurementprecisionmust be interpreted in light of measurementaccuracy. Let’s use a target practice example: Content Goal 13
SWTJC STEM – ENGR 1201 Precision – Target 3 Measurementprecisionmust be interpreted in light of measurementaccuracy.Let’s use a target practice example: Content Goal 13
SWTJC STEM – ENGR 1201 Precision – Target 4 Measurementprecisionmust be interpreted in light of measurementaccuracy. Let’s use a target practice example: Content Goal 13
SWTJC STEM – ENGR 1201 Precision - Comparison Which is the best and which is worst? Most Insidious Why? Best Worst Content Goal 13
SWTJC STEM – ENGR 1201 Error Types Errors in measurement can be classified in two types: 1. Systematic Errors “result from an inherently wrong measurement”2. Random Errors “result from externally introduced factors” Content Goal 13
SWTJC STEM – ENGR 1201 Systematic errors “result from an inherently wrong measurement” The measuring instrument and/or procedure is flawed in some specific way. One characteristic of systematic errors is that they are generally either positive or negative and of roughly constant value. Systematic Errors Tires Example I Jake has decided to use oversize tires on his truck, but his dad reminds him this could affect the speedometer and odometer readings. Explain. Content Goal 13
SWTJC STEM – ENGR 1201 Systematic ErrorsTires Old Tire New Tire Speedometer and odometer operation is based on number of tire rotations. The new tire will make fewer revolutions. Why? Show that a10% increasein tire diameter will cause a10% low readingin speed and distance. (Exam question) Content Goal 13
SWTJC STEM – ENGR 1201 Systematic ErrorsBarometric Pressure Example II San Juana has been assigned a school project to record atmospheric pressure at noon for a two week period and plot the data with Excel. She learns of an Internet site operated by her school that provides hourly data including atmospheric pressure. So for two weeks she links to the site and records the data in a spreadsheet. She creates the chart and prepares to turn in the project when she learns that the school’s electronic barometer was improperly calibrated and was reading 0.05 inches of Hg too high. Why is this a systematic error? Content Goal 13
SWTJC STEM – ENGR 1201 Systematic ErrorsBarometric Pressure Content Goal 13
SWTJC STEM – ENGR 1201 • Random errorsare “not inherent to the measuring process”. • Frequently they are introduced by external factors that cause ascattering of the measured data. • When the scattering is distributed equally about the true value, the error can be mitigated somewhat by making multiple measurements and averaging the data. • Vibration in mechanical devices produces random errors. • In electronic devices, noise produces random errors. Random Errors Content Goal 13
SWTJC STEM – ENGR 1201 Random ErrorsWave Action Example I Jane is working as an intern for the national park service during the summer and has been assigned the task of monitoring the water level at Lake Amistad near Del Rio, Texas. A measurement rod at the end of a pier is marked with depth graduations to make the job easier. At 11:00 AM the first day she prepares to take the daily measurement, but immediately encounters a problem. Wind induced wave action on the lake causes the water level to rise and fall on the measurement rod making it difficult to read. Why is the errorrandom? How can she mitigate it. Content Goal 13
SWTJC STEM – ENGR 1201 Random ErrorsWave Action High Water Mark (H) Typical Wave Mean Wave Height (M) Low Water Point (L) Jane Reports: M = (H + L) /2 Measuring Rod Content Goal 13
SWTJC STEM – ENGR 1201 Example II Richard is helping test engine performance at Southwest Research Labs in San Antonio. Fuel pressure is being monitored electronically and recorded using a computer. The data is copied to Excel and plotted. A typical recorded segment is shown in the chart below. Because of engine vibration effects on the pressure sensor as well as electronically induced noise, the fuel pressure data is somewhat erratic (blue line). The effects are clearly random in nature so he proposes to add an averaging circuit to "smooth" the output. After doing so, the fuel pressure data plot is much smoother (red line). By averaging out the error, the resulting data is more representative of the actual fuel pressure. Random ErrorsEngine Test Content Goal 13
SWTJC STEM – ENGR 1201 Random ErrorsEngine Test Content Goal 13
SWTJC STEM – ENGR 1201 • Accuracy "refers to how close the reported value comes to the true value“ • Precision "refers to the clustering of a group of measurements“ Quality Factors Scientists and engineers express measurement quality using, Content Goal 13
SWTJC STEM – ENGR 1201 Error Types Errors in measurement can be classified in two types: 1. Systematic Errorsresults from a measurement that is inherently wrong.2.Random Errorsresults from the effect of external factors. Content Goal 13