Download
1 / 14
140 likes | 488 Vues
RATE OF CHANGE AND DIRECT VARIATION. SECTION 5.3. VERTICAL AXIS. HORIZONTAL AXIS. HORIZONTAL CHANGE. VERTICAL AXIS. VERTICAL CHANGE. HORIZONTAL AXIS. slope.

E N D
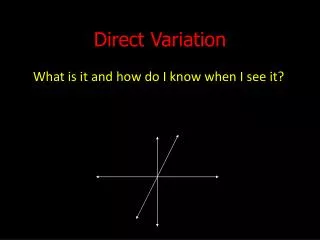
RATE OF CHANGE AND DIRECT VARIATION SECTION 5.3
VERTICAL AXIS HORIZONTAL AXIS HORIZONTAL CHANGE VERTICAL AXIS VERTICAL CHANGE HORIZONTAL AXIS slope Rate of change is related to the __________ of a line because they are both a ratio of the change in ______ over the change in __________. vertical horizontal
The graphs below show the distance that an object travels at a constant speed. Example 1: Find the speed (rate of change) for each object. 2000 800miles 80 minutes 1600 1200 80 Distance (miles) 800 800 10 miles per minute 400 20 40 60 80 100 120 Time (minutes)
The graphs below show the distance that an object travels at a constant speed. Example 1: Find the speed (rate of change) for each object. 200 60 miles 1.0 hours 160 1.0 120 Distance (miles) 60 80 60 miles per hour 40 0.5 1.0 1.5 2.0 2.5 3.0 Time (hours)
50 feet 3 seconds 3 100 80 50 60 Distance (feet) 40 20 16.7 feet per second 1 2 3 4 5 6 Time (seconds)
750 miles 4 days 2500 2000 4 1500 Distance (miles) 750 1000 187.5 miles per day 500 4 8 12 16 20 24 Time (days)
The graph below was made from data collected by a motion detector. In the experiment, a student walked in a straight line away from the motion detector. Describe the movement of the person by identifying the rates of change shown on the graph below. The student walked forward 5 feet in 3 seconds. 10 He then walked backwards 3 feet in 2 seconds. 8 He stood still for 1 second. 6 Distance (feet) He then walked forward 2 feet in 3 seconds. 4 2 2 4 6 8 10 12 Time (seconds)
One type of rate of change is ______________. direct variation If y varies directly as x, then ____________, or _____________, where k is the constant of variation.
Example 2:Looking For the Constant of Variation (k) when , find the constant of variation A. If y varies directly as x and and write the equation for direct variation.
B. If y varies directly as x and when , find the constant of variation and write the equation for direct variation.
If y varies directly as x and when , find the constant of variation and write the equation for direct variation.
Example 3:Looking For the missing value of x or y. when , find x when A. If y varies directly as x and You can set up and solve a proportion to find x or y. .
when , find y when A. If y varies directly as x and .
when , find x when If y varies directly as x and .