Download
1 / 23
230 likes | 455 Vues
Unit 12: Precipitation, Air Masses, and Fronts. Air masses Lifting Mechanisms for Precipitation Thunderstorms and related phenomena (tornadoes). A front in the making over the N Pacific Ocean. OBJECTIVES

E N D
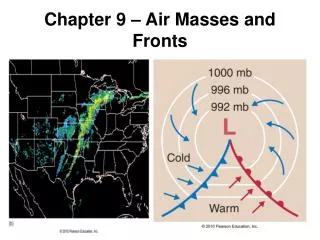
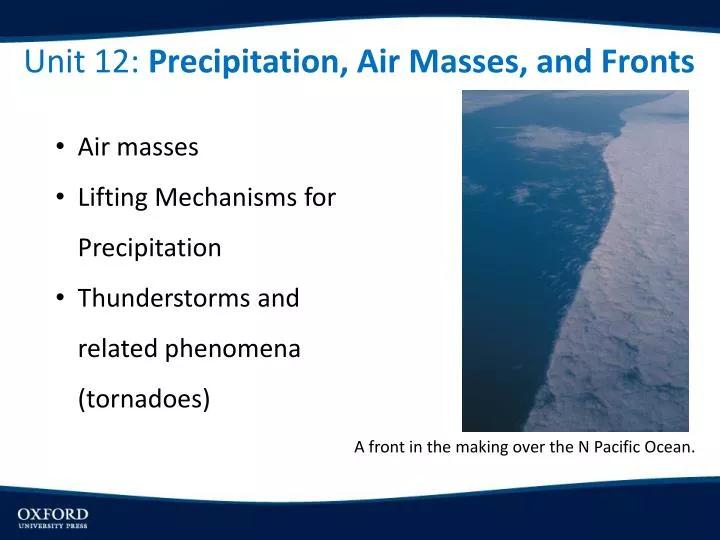
Unit 12: Precipitation, Air Masses, and Fronts • Air masses • Lifting Mechanisms for Precipitation • Thunderstorms and related phenomena (tornadoes) A front in the making over the N Pacific Ocean.
OBJECTIVES • Develop the concept of air masses—their character, origin, movement patterns, and influence on precipitation. • Explain lifting mechanisms behind precipitation. • Discuss the four basic mechanisms for producing precipitation: convergent lifting, frontal, convectional, and orographic precipitation.
Air Masses An air mass is a large body of air with relatively homogeneous character of temperature and humidity. Classification by latitude, moisture mT, mP, cA, cP, cT Movement and transitions-character of air masses can change as moves over different land surfaces, or crosses mountains, ie mP can become cP after crossing the Rockies, cP can become mT when moving over warm water. Source: https://www.meted.ucar.edu/sign_in.php?go_back_to=http%253A%252F%252Fwww.meted.ucar.edu%252Ffire%252Fs290%252Funit7%252Fprint_3.htm
North American Air Masses & Sources Source regions and common paths of the principal air masses that affect the continental United States.
Lifting Mechanisms That Produce Precipitation • Convergence-when similar air masses • converge, they are forced to rise, • forming clouds • Convection-surface heating causes • warm air parcel to rise and form clouds • Orographic-mountains and large • obstacles force air to rise, forming clouds • Frontal-when warm and cold air masses • meet, cold air lifts warmer air forming clouds Source: http://keithrogershome.com/Chap7CldsPcpnFog.html
Lifting by Convergence Along the ITCZ warm trades meet and rise. Precipitation along the ITCZ shifts with season, into the summer hemisphere. Average daily rainfall rates (mm/day) for January and July based upon measurements from the Tropical Rainfall Measuring Mission (TRMM) satellite for the years 1998-2007.
Frontal Precipitation Vertical cross-section through a warm front (top) and cold front (bottom). The vertical scale is greatly exaggerated. Warm fronts typically have a 1:200 vertical-to-horizontal ratio; the ratio for cold fronts is approximately 1:70.
Convectional Precipitation Convection often leads to isolated showers from building cumulus clouds. Occasionally, these clouds grow large enough to form thunderstorms. Each thunderstorm cloud, cumulonimbus, has a life cycle of 3 stages. The three stages of the life cycle of an air mass thunderstorm: cumulus, mature, and dissipating. Updrafts dominate the developing stage, both updrafts and downdrafts are found during the mature stage, while only downdrafts are found during the dissipating stage. The approximate width at each stage of the thunderstorm is shown at the bottom.
Cumulonimbus grows near the Canadian Rockies in an afternoon thunderstorm. Source: http://www.physicalgeography.net/fundamentals/7t.html
Severe Thunderstorms Conceptual model of a severe thunderstorm producing sizeable hailstones. The red dashed lines represent the warm updrafts, the blue lines show the cold downdrafts, and the green lines represent the movement of hailstones. The thunderstorm is moving from left to right.
Global Lightning Distribution Average yearly number of lightning flashes observed by satellites between 1995-2003. Widespread convergence and convection in the tropics and along the Equator produces air mass thunderstorms that are present year round. Air mass thunderstorms and severe thunderstorms along frontal boundaries occur during the warm season in the middle latitudes. Thunderstorms are much less common in the high latitudes due to the weak surface heating and more limited air mass contrasts. Source: http://www.lbagroup.com/international/tower-lightning-protection.php
Thunderstorms Figure 5.36
Tornadoes and Their Impacts • Tornadoes occur in most mid-latitude continents, where warm and cold air masses collide and strong polar jet streams add windshear. • Tornadoes are extremely low pressure vortices that descend from powerful thunderstorms to the ground. They may be smaller than a city block, but have winds of up to 130 m/sec (300 mph). Strong winds and large pressure gradients can pick up or move huge objects or destroy houses. • The U.S. has more than 1000/yr with most in tornado alley (the south central Plains) • Tornadoes occur in all 50 states • and in all months, with most • occurring in spring-early summer. Source: http://www.spc.noaa.gov/faq/tornado/
Damage path of EF-5 tornado that ripped through Joplin, Missouri on May 22, 2011.
April 27, 2011 Tuscaloosa, Alabama in the most deadly tornado day since 1925 Tri-state outbreak. In the 3-day outbreak across the SE, 358 tornadoes struck with 324 fatalities.
Tornadoes Figure 5.39
2011 Tornado Reports-Nearly 1700 confirmed April 2011 set records with 875 tornadoes, 226 on April 27th.
Tornadoes occur in all 50 states, with tornado alley (south central Plains) having the highest frequency in the world. Source: http://www.spc.noaa.gov/wcm/ustormaps/1981-2010-stateavgtornadoes.png
Southern states have less storm shelters, basements; more mobile homes. Source: http://www.spc.noaa.gov/wcm/ustormaps/1981-2010-stateavgfatals.png
Source: http://www1.ncdc.noaa.gov/pub/data/cmb/images/tornado/clim/tornadoes_bymonth.png
Orographic Precipitation Fig 13.7 Orographic precipitation on the upper windward slope of the Cascade Mountains in west-central Oregon. Note the significant temperature and moisture differences between the windward and leeward sides of this major mountain barrier. (Vertical scale is greatly exaggerated.)
Fig 13.8 Oregon’s precipitation pattern, with the distribution of isohyets exhibiting the results of the orographic effect as westerly winds off the Pacific are forced across the north-south-trending Cascade Mountains. The transect across the Cascades between Eugene and Bend, diagrammed in Fig. 12.10, is marked by a red line.