Testing- and Calibration Technology
260 likes | 447 Vues
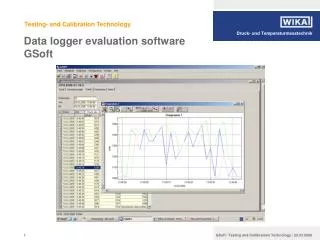
Testing- and Calibration Technology. Data logger evaluation software GSoft. 1. Data logging in process. … with handheld CPH 6200 / CTH 6200 and data logger evaluation software GSoft. 2. Handheld with evaluation software GSoft. temperature. Software features:

Testing- and Calibration Technology
E N D
Presentation Transcript
Testing- and Calibration Technology Data loggerevaluationsoftwareGSoft 1
Data logging in process …with handheld CPH 6200 / CTH 6200 and data logger evaluation software GSoft 2
Handheld with evaluation software GSoft temperature Software features: - Easy operation due to self-explanatory icon buttons - Zoom function available - Remote operation via PC possible - Data can be exported to Excel®, etc. - Language: English, German, France, Spain, ... pressure CPH 6200 CTH 6200 Instrument features:- CPH 6200 and CTH 6200 can store measurement data (Logger integrated)- Possibility of cyclic storage of the measurement data- Storage up to 16,200 measurement data (depending on the model) 3
Starting logger (measurement storage) Measuring mode Logger active H 2sec Initial state:measuring mode* Cyclic measurement storage is active. Logger active: until stopped manual by the user or logger reaches total storage capacity (up to 16,200 measurement data) *cyclic logger has been activated before via menu. 4
Stopping logger (measurement storage) Stop logger?NO Stop logger?YES? Measuring mode Logger active H H H Initial state:measuring mode Cyclic measurement storage is active. Logger can be stopped: by pressing Safety function: should measurement storage be stopped? Choice via or Button stops the logger 5
Connecting the Handheld with PC GSoft offers the possibility to show the measurement data on PC as table or diagram Measurement data Transfer of the measurement data to PC via RS232- or USB-interface 6
1. Interface configuration Click to choose the interface 8
Confirmation of interface 1. Interface configuration 9
Search Handheld 2. Creating a connection with the Handheld 10
Transfer actual status of the Handheld 3. Read actual status of the Handheld 11
Read logger data 4. Showing actual status of the Handheld Sensor data at the moment when the actual status is read out Stored logger data are shown 12
Create chart 5. Logger data are shown as table Logger data are shown 13
Select data 6. Presettings of the graph 14
Further information 1.) Graph options: zoom function 2.) Peak detection via min/max function 3.) Start logger, if any data are already in the logger 4.) Software update 5.) Outlook 6.) Product Support 16
1.) Graph options: zoom function After marking an area with the left mouse button, the zoomed graph will be shown 17
1.) Graph options: zoom function Via the scrolling button you can scroll your zoomed graph in every position you want 18
2.) Peak detection via min/max function Available peak in the time span between 17:40:03 and 17:40:04 Actual measure data 17:40:04 In addition to the actual measured value, the min- and max-values also will be stored and can be shown in the graph. (Choice via the window “Create New Diagram”) The sample shows, in the time span between 17:40:03 and 17:40:04 there was a peak of about 0,64 bar which will be read out and shown in the graph parallel to the actual measure data of the time 17:40:04. 19
3.) Startlogger, if any data are already in the logger Measuring mode Clear existing logger data? NO? Clear existing logger data? YES? Measuring mode H H H 2sec Delete old measurement data: by pressing for 2seconds Safety function: should the stored measurement data really be cleared? Choice via or Button clears the existing measurement data Initial state: New logger data can be stored (see description above) 20
4.) Software update Software update on www.wika.de : //Download/Software/Calibration Technologyfor free. 21
4.) Software update Download file (update file) has to be stored in the same folder in which the program GSoft is located 22
4.) Software update Starting the update file To start the update, double-click on the update file 23
5.) Outlook Possibility to show pressure- and temperature data in one graph Both data sets have to be stored as 2 files. Thus both files can be opened and displayed in one diagram. 24
5.) Outlook Possibility of „Copy and Paste“. Easy to import measurement data in a Excel-sheet GSoft Excel sheet 25
6.) Product Support For sales information please contact Heike ScherfGB-PI-PKTel 09372 / 132-473Fax 09372 / 132-217E-Mail: h.scherf@wika.de For technical information please contact Alois GrimmCTTel 09372 / 132-8916 Fax 09372 / 132-8008916E-Mail: a.grimm@wika.de 26