Enhancing Collaborative Visualization: CSIRO's CURVS and OptIPortal Systems
The CSIRO’s e-Research Program has developed a pioneering visualization system, CURVS, with large-scale tiled displays to facilitate interaction and collaboration. Features include multi-touch tabletops and gesture input for seamless data manipulation across >100 Mpixel displays. The system supports visualization of complex datasets across various domains, enhancing group collaboration in real-time. This initiative utilizes standard Dell hardware and advanced visualization software, aiming for widespread application in fields like genomics, environmental monitoring, and more, while addressing unique user requirements.

Enhancing Collaborative Visualization: CSIRO's CURVS and OptIPortal Systems
E N D
Presentation Transcript
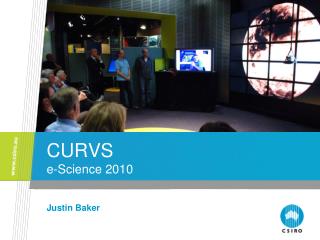
CURVS e-Science 2010 Justin Baker
CSIRO Tiled Displays - Background Two large OptIPortals deployed at CSIRO 25x30” displays, 5x5 grid, 14 clustered PCs >100Mpixel resolution Ongoing interaction research Multi-touch tabletops, portable devices Gesture input, touch points mapped to display-wall Tap to select, drag-and-drop using multi-finger gestures CSIRO eResearch Program Signed off in 2009 Visualisation recognised as one of several key enabling technologies Formation of eResearch Viz Team (Dec 2009) Initial idea to fund 2-3 more large OptIPortals 2
CSIRO Visualisation CSIROUltrahighResolutionVisualisationSystems • Instead of OptIPortals... • EOI announced in Nov 2009 • 4 submissions representing11 systems • Genomics, environmental monitoring, materials, human factors. • Commonalities – exploring large/complex datasets, collaborative real-time viz, associated video-conferencing • Hardware now assembled at all avail sites • Finalising details for software configuration • Automated session management, simplified authentication, app set up, tiled display layout 3
CURVS Possible Use Cases • Large scale visualisation • Very large 2D datasets and potentially 3D • Examples: astronomical data, GIS, microscopy • Viewing a range of datasets simultaneously • Compare multiple similar datasets • Lots of separate displays not necessarily related • Portable “visualisation lab” • Group might book the facility for a designated period • Collaborative viewing • Controlled/driven remotely • “Moving Poster” • Conference, public presentations etc
CURVS Specifications • Relatively simple design • Standard Dell hardware • 1x 3D Visualisation head node • 3D hardware capable (FX5800) • 1x Single 2D “Display node” (ATI) • 6 x 30” monitors • Total resolution of around 24Mpixels • 12x improvement on a standard desktop PC
CURVSVisualisation Software • VirtualGL • Remote visualisation, virtualised graphics • Allows for shared remote collaborative viewing • Access to Linux visualisation software for Windows users • VirtualBox • Sun open source virtualization solution • A combination of VirtualBox and VirtualGL lets you display Windows 3D applications remotely
CSIRO Visualisation CURVS Issues • VirtualGL • Low frame rates at large screen sizes • VirtualBox • Windows texture mapping (occasional) • TurboVNC • Best VNC client with VirtualGL but crashed when window resized too large (fixed) • Desktop (Nautilus?) • Strange key mapping (template file fixed) 9
CSIRO Visualisation Plans for 2010-2011 • Finalise 1st Round CURVS deployment • Customise group specific apps and configurations • Trial WA specific screen config (2x3 instead of 3x2) • Complete by Jan 2011 • Revisit CURVS Design • PIR of 1st round • Improve design – eg more displays, diff graphics cards • Assess demand for 2nd round and/or full-scale OptiPortals 10
Justin Baker ASC Collaboration and Visualisation Manager Phone: 03 86013801 Email: justin.baker@csiro.au
CSIRO today: a snapshot Australia’s national science agency One of the largest & most diverse in the world 6500+ staff over 55 locations Ranked in top 1% in 14 research fields 20+ spin-off companies in six years 160+ active licences of CSIRO innovation Building national prosperity and wellbeing 12
WATER OCEANS ENERGY LANDSCAPES CLIMATE FOOD &AGRICULTURE MINERAL RESOURCES SAFEGUARDING AUSTRALIA MANUFACTURING AND MATERIALS SERVICES AND ICT PROMOTINGHEALTH UNDERSTANDING THE UNIVERSE Delivering our science: key outcome domains