Download

1 / 24
240 likes | 420 Vues
Fisher information-based evaluation of image quality for time-of-flight PET. Kathleen Vunckx 1 , Lin Zhou 1 , Samuel Matej 2 , Michel Defrise 3 , Johan Nuyts 1.

E N D
Fisher information-based evaluation of image quality for time-of-flight PET Kathleen Vunckx1, Lin Zhou1, Samuel Matej2, Michel Defrise3, Johan Nuyts1 1 Dept. of Nuclear Medicine, Katholieke Universiteit Leuven, Leuven, Belgium.2 Dept. of Radiology, University of Pennsylvania, Philadelphia, USA. 3 Dept. of Nuclear Medicine, Vrije Universiteit Brussel, Brussels, Belgium.
Outline • Introduction: TOF PET • Aim & motivation • Image quality evaluation methods • Simulations & results • Conclusions & future work
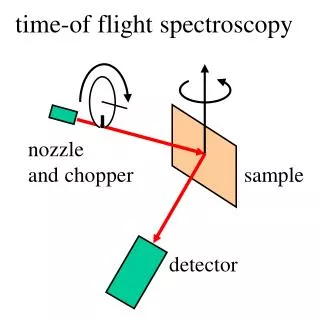
Conventional PET Time-of-flight PET Introduction: TOF PET Time annihilation detection: Annihilation location: Localization uncertainty: Time resolution
Slice A Slice B CT CT non-TOF non-TOF TOF TOF Introduction: TOF PET Philips Gemini TF PET/CT Courtesy of S. Matej et al.
Outline • Introduction: TOF PET • Aim & motivation • Image quality evaluation methods • Simulations & results • Conclusions & future work
Aim & motivation • Effect TOF information on image quality? • Influence TOF kernel accuracy on image quality? Time difference=Extra information Conventional PET Time-of-flight PET
Outline • Introduction: TOF PET • Aim & motivation • Image quality evaluation methods • Tomitani’s analytical TOF gain calculation • Fisher information-based evaluation method for TOF PET • Simulations & results • Conclusions & future work
Dx D Tomitani’sanalytical TOF gain calculation non-TOF PET** TOF PET* Restrictions: • Only for central point(s) of a largeuniformnon-attenuatingdisk source • For FBP-like reconstructions Gain* (standard deviation FWHM) amount of detected coincidences per cm² resolution in reconstructed image (FWHM) * Tomitani, IEEE TNS 28(6), 1981. ** Tanaka et al., Comp. Biol. Med., 1976.
Fisher information-basedevaluation method for TOF-PET • Fisher information covariance matrix of measurement projection backprojection • Efficient approximations for image quality of post-filtered MLEM: • Linearized local impulse response (LLIR) • (Co)variance in 1 pixel or small ROI MLEM post-filter Fessler et al., IEEE TIP 1996.Qi et al., IEEE TMI 2000.Vunckx et al., IEEE TMI 2008. Fixed target resolution
Fisher information-basedevaluation method for TOF-PET Approximations for individual pixels Approximations for ROI Also possible to insert TOF kernel mismatch in model due to local shift invariance pixels in ROI pixel j with r = # pixels in ROI
Outline • Introduction: TOF PET • Aim & motivation • Image quality evaluation methods • Simulations & results • Sim. 1: Tomitani versus Fisher information • Sim. 2: Attenuating ellipse • Sim. 3: Realistic thorax phantom • Sim. 4: Effect accuracy TOF kernel • Conclusions & future work
D= 35.0cm Simulation 1:Tomitani versus Fisher information • Homogeneous diskD = 35 cm • No attenuation, no scatter, no randoms, no detector resolution • Pixel size 0.2 cm • FOV of 67.2 cm • Target resolution 0.6 cm FWHM Nice agreement!
Da = 43.8cm 0.4 Da Db = 28.0cm 0.4 Db Simulation 2:Attenuating ellipse • Homogeneous ellipseDa= 43.8 cm, Db = 28.0 cm • No scatter, no randoms, no detector resolution • Attenuation (water) • Pixel size 0.2 cm • FOV of 67.2 cm • Target resolution 0.6 cm FWHM non-TOF 1.25 17.85 3.37 non-TOF 1.45 1.75 13.9013.73 2.523.31 Gain increases faster in the center!
> 5 4 3 2 1 0 Simulation 3:Realistic thorax phantom True activity • 2D realistic thorax phantom • No scatter, no randoms • Attenuation modeled • Intrinsic resolution 0.5 cm • Pixel size 0.3375 cm • FOV of 64.8 cm • Target resolution 1.2 cm FWHM TOF PET variance Dt = 500 ps Non-TOF PET variance Variance improvement due to TOF information
Simulation 3:Realistic thorax phantom Fisher information-based method Based on recon. of 300 noisy proj. data sets True activity TOF PET variance Dt = 500 ps Non-TOF PET variance > 5 4 Variance improvement due to TOF information 3 2 1 0
D= 27.0cm ROI diam 1.3cm 7cm Simulation 4:Effect accuracy TOF kernel Dt = 300 ps FWHM? • TOF kernel might not be known accurately Effect on image quality? Narrower contrast Wider contrast Daube-Witherspoon, Matej et al., 2006 IEEE NSS Conf. Rec.
D= 27.0cm 7cm ROI diam 1.3cm Simulation 4:Effect accuracy TOF kernel Real TOF kernel Dt = 300 ps Target resolution 6 mm CNR ROI mean ROI variance ROI recon TOF kernel FWHM (ps) recon TOF kernel FWHM (ps) recon TOF kernel FWHM (ps) post-smoothed impulse response post-smoothed impulse response Too narrowDt = 150 ps Too wideDt = 600 ps pixels pixels
D= 27.0cm 7cm ROI diam 1.3cm Simulation 4:Effect accuracy TOF kernel Real TOF kernel Dt = 300 ps Target resolution 6 mm CNR ROI mean ROI variance ROI recon TOF kernel FWHM (ps) recon TOF kernel FWHM (ps) recon TOF kernel FWHM (ps) post-smoothed impulse response post-smoothed impulse response Too narrowDt = 150 ps Too wideDt = 600 ps pixels pixels
Simulation 4:Effect accuracy TOF kernel Reconstructions homogeneous sphere F 27 cm Real TOF kernel Dt = 300 ps TOO NARROW CORRECT TOO WIDE activity Recon TOF kernel FWHM Dt = 150 ps Recon TOF kernel FWHM Dt = 300 ps Recon TOF kernel FWHM Dt = 600 ps pixels (column coordinates)
Simulation 4:Effect accuracy TOF kernel (imposed target FWHM) Gaussian post-filter CNR ROI mean ROI variance ROI recon TOF kernel FWHM (ps) recon TOF kernel FWHM (ps) recon TOF kernel FWHM (ps) Optimal post-filter (imposed Gaussian shape and FWHM) CNR ROI variance ROI mean ROI recon TOF kernel FWHM (ps) recon TOF kernel FWHM (ps) recon TOF kernel FWHM (ps)
Outline • Introduction: TOF PET • Aim & motivation • Image quality evaluation methods • Simulations & results • Conclusions & future work
Conclusions • Gain in center increases with diameter and TOF resolution: • Gain in all pixels • Slower increase in eccentric and high-count regions
Conclusions Gaussian post-filter Optimal post-filter Accurate kernel: best contrast vs.variance trade-off, best CNR Kernel too narrow: contrast contrast = variance variance CNR Kernel too wide: contrast contrast = variance variance CNR artifacts Flat optimum!
Future work • So far: • Design evaluation for multipinhole SPECT • Effect of overlapping projections in multipinhole SPECT • Image quality improvement due to TOF • Also interesting: • Effect of randoms, scatter, … for TOF PET • 3D TOF PET • Rotating slat hole SPECT (Lin Zhou)