Download
1 / 19
190 likes | 366 Vues
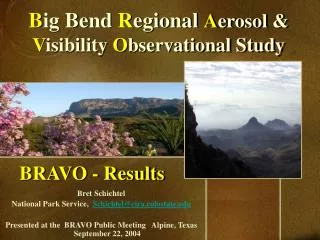
B ig Bend R egional A erosol & V isibility O bservational Study. BRAVO - Results. Bret Schichtel National Park Service, Schichtel@cira.colostate.edu Presented at the BRAVO Public Meeting Alpine, Texas September 22, 2004. BRAVO Study Purpose.

E N D
Big Bend Regional Aerosol & Visibility Observational Study BRAVO - Results Bret Schichtel National Park Service, Schichtel@cira.colostate.edu Presented at the BRAVO Public Meeting Alpine, Texas September 22, 2004
BRAVO Study Purpose • The BRAVO Study’s chief purpose is to quantify the contribution to visibility degradation at Big Bend National Park (BBNP) from various air pollution source regions and source types in the U.S. and Mexico.
Big Bend Extinction Budget – 1998–2002 Spring Peak (Apr-Jun) Sum/Fall Peak (Aug-Oct) Clear Air Sulfate compounds are the largest contributor to haze. Big Bend haze peaks during two periods: springtime when sulfate and organics are the largest contributors and summer/fall when sulfate contributions dominate.
Springtime Smoke Impacting Big Bend Location of Fire SeaWiFS Satellite imagery Mar, Apr, May is the peak fire season in Mexico and Central America. May, 1998 smoke from large fires in Central America impacts Big Bend and the U.S. Similar fires occurred in 2000.
Summertime Dust Impacting Big Bend Dust cloud leaving Africa Saharan dust in the Gulf of Mexico In July and August dust from Sahara Africa regularly the U.S. from Florida to Big Bend NP.
BRAVO Monitoring NetworkGas and Aerosol Sampling Locations Measurements at 37 sites July 1 – October 31, 1999.
BRAVO Study Site at KBar Measurements included speciated fine particles, gases, light scattering & absorption, particle size, meteorological parameters, and tracer concentrations.
Big Bend Source Attribution during BRAVO The contribution from the SO2 source regions: Texas, eastern US, western US, Mexicoand sub-regions includingCarbon I & II and east Texas, to Big Bend’s particulate sulfate and haze were modeled.
Models: Linking Emissions to Measured Pollutants • Multiple source attribution methods were used to apportion Big Bend’s sulfate haze to source regions. • All techniques were extensively evaluated against measured and synthetic data sets. • All results were reconciled resulting in a single BRAVO best estimate Pollutants are emitted from a source, transformed in the atmosphere, and transported with the winds. Along the way they become diluted or may deposit out as dry particles, or in rain, fog, or snow.
Big Bend Source Attribution Results Average source attribution of Big Bend’s particulate sulfate and haze during the BRAVO Study
Sulfate Source Attribution vs SO2 Emissions • The SO2 emissions from Carbon I & II are 5 times more efficient at causing haze at Big Bend than sources in Texas. • The SO2 emissions from Texas are 8 times more efficient at causing haze at Big Bend than sources in eastern U.S.
Big Bend’s Sulfate Haze Source Attribution Eastern US Mexico Texas
Contribution to Big Bend’s Haze - BRAVO Western US 2 % Percent contribution to particulate haze are in parentheses • Sulfate contributes 21% of the haze onclear days (Mexico: 10%, U.S.: 8%). • Sulfate contributes 47% of the haze onhazy days (Mexico: 14%, U.S.: 31%). The relative contributions to light extinction by eastern U.S. and Texas sources of particulate sulfate at Big Bend increase by factors of about 4 and 5, respectively, on the haziest days compared to the least hazy days of the study period.
Hazy Day Least Hazy Day Clear Day Bext ~10 1/Mm
What is Causing Big Bend’s Haze? • Sulfate is the single largest contributor to haze at Big Bend NP. • Big Bend is one of the only national parks where sulfates and haze are increasing. • Some of the highest haze episodes during the spring season are caused by international transport of dust and smoke.
Where Does the Haze Come From… • During BRAVO there were days where SO2 sources in either the eastern U.S., eastern Texas, or Mexico were each most responsible for the haze. • The most intense sulfate-dominated haze episodes tended to include significant contributions from SO2 sources in the eastern U.S. and east Texas. • Contributions from sources in Mexico were more persistent and tended to be the dominant contributor during less intense sulfate haze episodes. • The Carbón power plant was the single largest contributor to Big Bend’s haze, during BRAVO.
Where Doesn’t the Haze Come From… • On the least hazy BRAVO days, Mexico and the western U.S. are the largest contributors. • In general the clearest visibility conditions at Big Bend occur most frequently in the winter when flow is most often from the north or west over areas of relatively low emissions density.
Thank-you The BRAVO report and other material can be found at: http://vista.cira.colostate.edu/improve/Studies/BRAVO/Studybravo.htm
How Can Visibility be Improved at Big Bend NP? • Significant SO2 emission reductions in both east Texas and eastern US. • Current and pending federal regulations should reduce sulfur dioxide emissions throughout the United States • SO2 emission reductions from the western U.S and Northern Mexico would help maintain and improve the least hazy days. • Control SO2 emissions from the Carbon power plants. • U.S. government has no jurisdiction in Mexico. Should explore the creation of partnerships between U.S. and Mexico government agencies to address the transport of pollution.