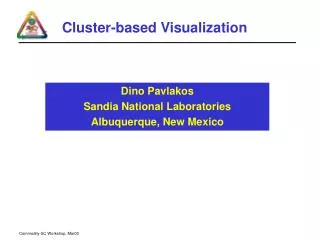
Cluster-based Visualization
Cluster-based Visualization. Dino Pavlakos Sandia National Laboratories Albuquerque, New Mexico. High End Graphics Platforms. 10 9. 10 8. SGI Graphics. Polygon Rendering Rate (Megapolys/Second). 10 7. PC Graphics. 10 6. 10 3. 1999. 2001. 2004. 100 Tflops. 3 Tflops. 10 Tflops.

Cluster-based Visualization
E N D
Presentation Transcript
Cluster-based Visualization Dino Pavlakos Sandia National Laboratories Albuquerque, New Mexico
High End Graphics Platforms 109 108 SGI Graphics Polygon Rendering Rate (Megapolys/Second) 107 PC Graphics 106 103 1999 2001 2004 100 Tflops 3 Tflops 10 Tflops Years/Compute Performance
Rendering and Sorting Sort Last Sort Middle Sort First Polygon Rendering Pipe
Renderer Renderer Renderer Display(s) Renderer Tiled vs. Single / Composite Displays Tiled Composite Renderer Renderer Display Renderer Renderer
Reducedpolys/data Data Exploration Architecture Data Archive Big Data ComputeService DataService Vis.Service UserWork- station Polys/Data Images Simulate Compress RenderDec/C DI DecompressUser dI render Dec/C DD Dd DI Archive
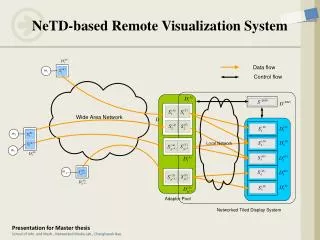
Tightly Coupled Compute, Data Services and Visualization InfiniBand x12 Link Speed: 6 GB/s Bidirectional (3 GB/s each way) 16 rows 16 rows Aggregate bandwidth across vertical plane: 768 GB/s each way, with 256 (16 x 16) rows (exceeds I/O requirements)
Visualization/Data Service Clusters @ SNL Existing • 16-node SGI/320 NT graphics cluster (GigE) • 72 node Compaq/NT data service cluster (ServerNet) Coming • 64 node graphics cluster (ASCI V1 Corridor) • 8-16 node graphics cluster (open testbed)
Cluster-based visualization issues • Rendering scalability vs. interactive latency • Expect good results for rendering large data • Getting high frame rates (e.g. 60Hz) harder • Dynamic resource management • Desktop access to large resource • Parallel/Scalable IO • Parallel inter-process communication (runtime visualization & data services, computational experiments) • Classified/Unclassified use
Cluster-based Composite RenderingSimplistic Projection • 16 node SGI/320 cluster • Peak 4 Million polygons/sec. per node • 16 x 4 = 64 Million polygons/sec. peak (perfect scaling) • Assume • 64 Million-Polygon surface data • Sort-last rendering (HW-accelerated) • 1K x 1K Display • Render 64M polygons in 1 sec. • Add .84 sec. composite time (Compaq NT cluster / ServerNet) • gives 35M polygons/sec. • Add .16 sec. composite time (ASCI Red) • gives 55M polygons/sec.
Parallel Visualization Abstract Partitioning Model DataRepository/Buffer DataRepository/Buffer ... AbstractData Space (Parallel Disk,Shared Memory, Dist. MemoryBuffer, …) DataInterface SimulationCode Data ServiceModule VisualizationModule ... ControlInterface
Do-It-All on C-Plant Instantiation ... AbstractData Space Disk1 Disk2 DiskN ... Comp 1 ... Comp 2 Node1 Node2 NodeN Comp N