Development and Development Indicators
Development and Development Indicators. Koichi Fujita Professor CSEAS, Kyoto University, Japan. Traditional Economic Indicators (1). GDP (Gross Domestic Product) and GNP (Gross National Product) What is the difference between the two? GNP and GNI (Gross National Income)


Development and Development Indicators
E N D
Presentation Transcript
Development and Development Indicators Koichi Fujita Professor CSEAS, Kyoto University, Japan
Traditional Economic Indicators (1) • GDP (Gross Domestic Product) and GNP (Gross National Product) What is the difference between the two? • GNP and GNI (Gross National Income) What is the difference between the two? • World Bank, World Development Report, annual issues. World Development Report 2010: Development and Climate Change World Development Report 2009: Reshaping Economic Geography World Development Report 2008: Agriculture for Development • World Bank, World Development Indicators, annual issues. World Development Indicators 2010
Traditional Economic Indicators (2) • Per capita GNI in 2008 (US$) • Market Exchange Rate vs. PPP (Purchasing Power Parity)
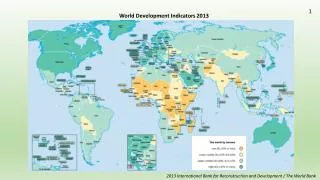
Categories by Traditional Economic Indicator • Categories by per capita GNI (PPP) by World Bank (2008) 1) High Income (11,906 US$ or more) Singapore, USA, Japan, Korea, Malaysia 2) Middle Income (976-11,905 US$) 2-1) Higher Middle (3,866-11,905 US$) China, Thailand, Sri Lanka 2-2) Lower Middle (976-3,855 US$) India, Pakistan, Bangladesh, Nepal 3) Low Income (975 US$ or less) • Low and Middle Income Countries Population (Million) Per capita GNI (PPP) East Asia & Pacific 1,931 5,398 Europe and Central Asia 441 12,219 Latin America & Caribbean 565 10,309 Middle East & North Africa 325 7,308 South Asia 1,543 2,734 Sub-Saharan Africa 818 1,991 Total 5,624 5,330 High Income 1,069 37,141
Explanation of PPP in World Development Report 2008 • PPP gross national income is GNI converted into international dollars using purchasing power parity (PPP) conversion factors, is included. Because exchange rates do not always reflect differences in price levels between countries, this table converts GNI and GNI per capita estimates into international dollars using PPP rates. PPP rates provide a standard measure allowing comparison of real levels of expenditure between countries, just as conventional price indexes allow comparison of real values over time. The PPP conversion factors used here are derived from the 2005 round of price surveys covering 146 countries conducted by the International Comparison Program. For OECD countries, data come from the most recent round of surveys, completed in 2005. Estimates for countries not included in the surveys are derived from statistical models using available data. For more information on the 2005 International Comparison Program, go to www.worldbank.org/data/icp. (World Bank, Eurostat/OECD)
From Income Poverty to Human Poverty • ‘Income Poverty’ can be measured basically by income and/or expenditure (PPP) at the household level. • Which is better, income or expenditure? • One argument is to consider the intra-household inequity in distribution of goods and services. • Another argument is to consider the living standardor quality of life enjoyed by each household or individual. • Various aspects of living standardor quality of life Nutrition, education, health (including reproducing health, infant health, etc.), safe water, sanitary, access to electricity, security, protection from risk or shock, dignity in the society, … • Based on arguments by Amartya Sen
Human Development Index (HDI) • UNDP (United Nations Development Program), Human Development Report, annual issues. Human Development Report 2009 Overcoming Barriers: Human Mobility and Development • HDI Life expectancy at birth Life expectancy index Adult literacy rate Gross enrolment ratio Education index GDP per capita GDP index HDI • HPI (Human Poverty Index) HPI-1, HPI-2
HPI (Human Poverty Index) • HPI-1 Probability at birth of not surviving to age 40 Adult illiteracy rate Percentage of population not using improved water source Percentage of children under weight-for-age HPI-1 • HPI-2 (for selected OECD countries) Probability at birth of not surviving to age 40 Percentage of adults lacking functionally literacy skills Percentage of people below the poverty line Long-term unemployment rate HPI-2
Index of Gender Issue • GDI (Gender-related Development Index) Female/Male life expectancy at birth Female/Male adult literacy rate Female/Male estimated earned income • GEM (Gender Empowerment Measure) Female/Male shares of parliamentary seats Female/Male shares of positions as legislators, senior officials and managers Female/Male shares of professional and technical positions Female/Male estimated earned income
Millennium Development Goals • Goals 1 Eradicate extreme poverty and hunger • Goals 2 Achieve universal primary education • Goals 3 Promote gender equity and empower women • Goals 4 Reduce child mortality • Goals 5 Improve maternal health • Goals 6 Combat HIV/AIDS, malaria, and other diseases • Goals 7 Ensure environmental sustainability • Goals 8 Develop a global partnership for development
Differences in Developing Countries Per capita GDPShare of Urbanization rate manufactured (2005→2015) goods in export Latin America & Callibbean 8,41754% 77.3%→80.6% East Asia & Pacific 6,60486%42.8%→51.1% South Asia 3,416 51% 30.2%→33.8% Sub-saharan Africa 1,988 34% 34.9%→39.6% DCs Total 5,282 71%42.7%→47.9%