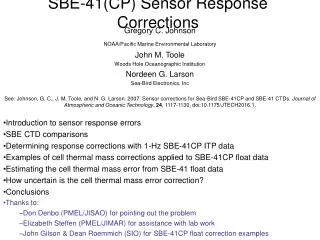
SBE-41(CP) Sensor Response Corrections
SBE-41(CP) Sensor Response Corrections. Gregory C. Johnson NOAA/Pacific Marine Environmental Laboratory John M. Toole Woods Hole Oceanographic Institution Nordeen G. Larson Sea-Bird Electronics, Inc

SBE-41(CP) Sensor Response Corrections
E N D
Presentation Transcript
SBE-41(CP) Sensor Response Corrections Gregory C. Johnson NOAA/Pacific Marine Environmental Laboratory John M. Toole Woods Hole Oceanographic Institution Nordeen G. Larson Sea-Bird Electronics, Inc See: Johnson, G. C., J. M. Toole, and N. G. Larson. 2007. Sensor corrections for Sea-Bird SBE-41CP and SBE-41 CTDs. Journal of Atmospheric and Oceanic Technology, 24, 1117-1130, doi:10.1175/JTECH2016.1. Introduction to sensor response errors SBE CTD comparisons Determining response corrections with 1-Hz SBE-41CP ITP data Examples of cell thermal mass corrections applied to SBE-41CP float data Estimating the cell thermal mass error from SBE-41 float data How uncertain is the cell thermal mass error correction? Conclusions Thanks to: Don Denbo (PMEL/JISAO) for pointing out the problem Elizabeth Steffen (PMEL/JIMAR) for assistance with lab work John Gilson & Dean Roemmich (SIO) for SBE-41CP float correction examples
Introduction to the Problem Conductivity (therefore salinity) is a strong function of temperature: -Roughly: 0.001°C -> 0.001 mmho cm-1 -> 0.001 in salinity Long, narrow glass conductivity cells (e.g. SBE cells) have significant heat capacity Temperature is measured near the intake of SBE ducted CTDs Conductivity is measured further downstream When sampling through temperature gradients: heat exchanges between the conductivity cell and water transiting the cell therefore temperature at the thermistor and in the cell can differ This temperature difference can induce an error in salinity Work has been done on this error for the SBE-9 at several flow rates Lueck, 1990; Lueck and Picklo, 1990; Morrison et al., 1994 Analyses exploit thermohaline staircases and up-down profile differences For a pumped SBE-9 (2 m s-1 ducted flow) experiencing a 1°C change at time to cell temperature error change is about 0.027H(t-to)e(-(t-to)/9s) For SBE-9 data with a 24-Hz time-series This correction can be accurately determined The correction is routinely applied
The SBE-41(CP) CTD SBE-9plus (for shipboard work) Always on Pumps at 2.0 m/s in the conductivity cell Partly to help match temperature and conductivity response Samples at 24 Hz SBE-41 (for low bandwidth low power application) Spot samples and pumps fast (2.7 m/s) for 2.5 s spot samples during the last second of pumping APEX float CTDs see ~ 0.016 m/s ventilation with pump off SBE-41CP for higher bandwidth low power application Always on Pumps slower (0.85 m/s in the co cell) continuously Samples at 1 Hz Data can be averaged or subsampled before transmission 41 & 41CP Temperature Sensor lag about 0.51 & 0.53 s Heat diffusion & boundary layer Conductivity Sensor lag about 0.05 s & 0.17 s Cell flushing & boundary layer Physical Separation of te & co about 0.06 & 0.20 s Flow rate & boundary layer Conductivity Cell Thermal Inertia ~ 10 s time-scale Heat diffusion & boundary layer
SBE-41CP 1-Hz data from an ITP The Ice Tethered Profiler (ITP) see http://www.whoi.edu/itp/ Reports 1-Hz SBE-41CP data Ascent rate of about 0.27 m/s Moored in the Arctic Ocean profiling through thermohaline staircases! First deployments ITP1, ITP2, ITP3 Deployments in August 2004 & 2005 Analysis through 27 January 2006. Analyze 298, 119, and 305 good (unfouled) ascending profiles Limit analysis to staircase region Use 34.1 < S < 34.8 and -1.2 < < 1.0 C as screen for this region This is between about 360 and 180 dbar About 640 (50) data points per profile First estimate & correct short time-scale sensor response errors Filter for thermistor lag Time shift for cell flushing time & physical sensor separation Then determine conductivity cell thermal mass correction
SBE-41CP Thermistor Lag Correction Thermistor lag (diffusion & boundary layer) Filter model is DT/dt = 1/T(To - T) t is time T is measured temp (black) To is true temp (magenta?) T is the time constant Expect about 0.50 s lag time Thermohaline staircases should be sharp Focus on thermohaline staircases Maximize # of data points in risers -Thermistor lag for three ITPs -Weighted median: T = 0.39 s
Raw te & co (black) -> salt spikes • Filter te & raw co (red) • Salinity spiking greatly reduced • Leave conductivity unfiltered • +0.17 s cell flushing time • +0.20 s transit thermistor to cell • Try a simple time-shift • Minimize salinity spikes in staircases • Actually std(d(S - S())/dt) • Tiny correction co shift • Median tp = 0.05 s SBE-41CP Conductivity Shift
SBE-41CP Thermal Mass Correction First apply the te filter & the co shift Then focus on the cell thermal mass Pick out low gradient regions 20 or more consecutive samples with T < 0.0015C between samples T < 0.0030C over the whole step Adjust and to minimize S variance in these regions Expect CTM = C (constant) Results: = 0.141 And CTM = 6.68 s
Correction in Frequency Space: Phase Initially te lags co T correction improves high frequency phase Co shift does very little Cell thermal mass improves low freq phase shift
Corrected SBE-41CP Float Data S Raw: Black S Cor: Red Temp: Green Short time-scale mismatches not corrected for in bin averaged (or subsampled data) Correction ameliorates ML base spikes Correction shift S saltier in strong temp gradients Examples courtesy of John Gilson
Where is the SBE-41 Error Visible? WMO #4900137 Profile #47 54.68N 178.26W 27 Sep 2002 Not in thermohaline staircases (vertical sampling too coarse) Not in ascending/descending profiles (only sample ascending) Look for S spike at the base of deepening mixed layers
Estimating the Error with SBE-41 Data Use PMEL & UW Profiling float data sets APEX floats with SBE-41 CTDs Near-surface pressure intervals 4- 8 dbar (PMEL) & 10 dbar (UW) Estimate elapsed time assuming an 0.09 dbar s-1 rise rate Apex ascent rate cycles from 0.06 to 0.12 dbar s-1 several times during each profile Courtesy of Dana Swift (UW) Use profiles with a well-defined mixed layer above a strong temperature gradient Require least 3 data points within thermal mixed layer, |-surface| < 0.01 C. Require |d/dt| > 0.01 C s-1 just below this thermal mixed layer Throw away > 200 s, > 0.2 C (outliers) Results: = 0.0267 C And = 18.6 s Faster rate when pumped -> smaller Lots of time unpumped (off) -> longer Poorly sampled gradients -> larger uncertainty UW clumps near = 0.025 C and = 20 s? minimization seeded at these values UW spike is often limited to 1 point One point can’t determine two unknowns = C still determined
What is the Error in Cell TM Correction? The correction requires The float rise rate The vertical temperature gradient The float rise rate for Apex APF-8’s is only known to 33% (0.09 0.03 dbar s-1) The correction time scale equates in pressure to About 2 dbar for the SBE-41 About 0.5 dbar for the SBE-41CP These scales are much finer than the reported intervals for float data Thus the correction should be uncertain The correction is uncertain: The standard deviation of is about 80% of the mean for SBE-41 profiles The correction error should be set equal in magnitude to the correction This correction is still useful because: It ameliorates unstable density spikes at the mixed layer base It removes a fresh bias in strong thermoclines
Conclusions The last row multiplied with dT/dt is about the size of Cell TM error (PSS-78) The SBE-41 error is about twice the SBE-9 error The SBE-41CP error is about quadruple the SBE-9 error All cell CTM errors can be corrected (to some degree) The SBE-41 correction will always be uncertain because Temperature gradients will not be resolved on the time-scale of the error Coefficients for the SBE-41 correction could change with sampling interval Because intermittent pumping complicates the co cell heat exchange SBE-41CP corrections could be improved: The corrections could even be applied to 1-Hz data before reduction Please don’t turn off the pump during ascent!
SBE-41(CP) Sensor Response Corrections Gregory C. Johnson NOAA/Pacific Marine Environmental Laboratory Brief introduction to sensor response errors See Johnson et al. (2007, J. Atmos. Oceanic Technol.) Also see Schmitt et al. (2005, J. Mar. Res.). What type of CTD is used (FSI Excell, SBE-41, or SBE-41CP)? If it is a SBE-41CP CTD, how is it used? What is the estimated ascent rate? What float is used? What data does the float return? Apply the correction Thanks to: Don Denbo (PMEL/JISAO) for pointing out the cell thermal mass error in float data Elizabeth Steffen (PMEL/JIMAR) for assistance with lab work Co-authors John Toole (WHOI) & Nordeen Larson (SBE) Dana Swift & Steve Riser (UW) for APEX ascent rate data John Gilson, Dean Roemmich, & Russ Davis (SIO) for SOLO ascent rate estimate examples
Sensor Response Errors Temperature Sensor lag For SBE-41 & SBE-41CP: Nominally 0.51 & 0.53 s Heat diffusion & boundary layer Conductivity Sensor lag Nominally 0.05 s & 0.17 s Cell flushing & boundary layer Physical Separation of te & co Nominally 0.06 & 0.20 s Flow rate & boundary layer Conductivity Cell Thermal Inertia Nominally ~10 s (pumped) Heat diffusion & boundary layer See Johnson et al. (2007, J. Atmos. Oceanic Technol.)
What Type of CTD is used? FSI Excell See Schmitt et al. (2005), J. Mar. Res., 63, 263-269 Temperature and conductivity time-scales internally matched by CTD Small cell thermal mass not corrected: tau = 0.0469 s, alpha = 2.0? Product is about 0.09 s, much smaller that SBE-41 or SBE-41CP SBE-41 Spot sampling, so no short (< 1 s) response corrections can be made Correct cell thermal mass errors only (tau = 18.6 s, alpha = 0.0267) SBE-41CP: How is it used? Reports 1-Hz Data Correct thermistor lag (0.39 s) Align conductivity and temperature (0.05 s) Correct cell thermal mass error (tau = 6.68 s, alpha = 0.141) Reports Bin-averaged or decimated data and pumps continuously Correct cell thermal mass error (tau = 6.68 s, alpha = 0.141) Reports spot samples with pump off in between? How long is it pumped before samples (hopefully “tswait” > 20 S) . . . If “tswait” < 20 s, then above model coefficients are not appropriate & error will be larger! Correct cell thermal mass error if possible
What is the float ascent rate? Does the float report elapsed sample time explicitly (or implicitly)? UW Iridium APEX floats with SBE-41CP implicitly measure time: Number of 1-Hz data points in each bin Velocity of "maintain minimum .08 m/s” controller Saw tooth pattern Rapid acceleration as oil is pumped Slower deceleration between pumping 0.09 dbar/s +/- 0.015 dbar/s Applies to most older APEX floats “Adaptive ascent” algorithm is rarer NAVOCEANO floats Data Courtesy of Dana Swift & Steve Riser (UW)
What is the float ascent rate? SOLO floats have a different pumping strategy Pump all oil at the start of ascent Ascent rate: v = (0.2 m2 s-2 kg-1*(*Vfloat - Mfloat))0.5 Empirically from: Float Mass, Volume Vfloat - Mfloat Density profile Decelerating: Fast at depth Slow near surface Depends on density profile What about the PROVOR? Any experts in the room? Data Courtesy of John Gilson, Dean Roemmich, & Russ Davis (SIO)
Correct for Cell Thermal Mass Error E-mail Gregory.C.Johnson@noaa.gov To get most recent code To get on a list for notification of revisions I will send celltm_sbe41.m [salt_cor] = celltm_sbe41(salt,temp,pres,e_time,alpha,tau); salt, temp, press are raw temperature, salinity and pressure Input must be sorted from first collected to last collected e_time is elapsed time from first data collected to last in seconds Estimated from float data and/or float ascent rate model alpha and tau depend on CTD model and use salt_cor is corrected salinity ordered as input For most float data: sensor response salinity error is probably about |salt_cor-salt|. At PMEL we use the following sequence for APEX APF-8 floats with SBE-41 CTD 1. Correct pressures for offset error 2. Correct salinity for pressure offset error 3. Apply sensor response correction (cell thermal lag) to salinity 4. Check for conductivity sensor drift and correct if necessary Assume thermal mass and calibration errors are independent
SBE CTD Comparisons Conductivity cell thermal mass error is a function of duct flow (governs heat exchange inside) Profiling speed (heat exchange outside & inside when not pumped) dT/dt modified by profiling speed changes Fast pumping (SBE-41) and slow profiling help to mitigate the error Floats don’t usually sample sufficiently to resolve the error time-scales
Correction in Frequency Space: Squared Coherence Ideal would be 1 T correction improves high frequency roll-off Co shift does very little Cell thermal mass slightly improves low freq
Correction in Frequency Space: Energy Energy Ratio, coherence, & phase of te & co 256 point segments centered at 240 dbar 10-1 Energy Ratio at lowest frequencies removed with linear fit Raw ratio low > 0.25 Hz (Te lag) Raw ratio high < 0.25 Hz (Co Cell thermal mass) T higher > .05 Hz tP (tiny) does nothing CTM optimum