Download
1 / 23
240 likes | 709 Vues
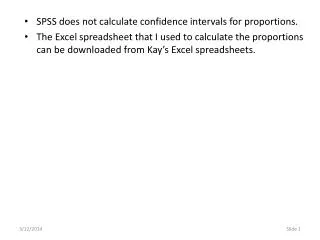
SPSS does not calculate confidence intervals for proportions. The Excel spreadsheet that I used to calculate the proportions can be downloaded from Kay’s Excel spreadsheets. . The introductory statement in the question indicates: The data set to use: GSS2000R.SAV

E N D
SPSS does not calculate confidence intervals for proportions. • The Excel spreadsheet that I used to calculate the proportions can be downloaded from Kay’s Excel spreadsheets.
The introductory statement in the question indicates: • The data set to use: GSS2000R.SAV • The task to accomplish: a confidence interval for proportions • The variable to use in the analysis: self-employment [wrkslf]. • The category to use for the confidence interval: self-employed
The first statement asks about the level of measurement. To compute a confidence interval for proportions, the variable must be categorical. We will use a frequency distribution to get a list of the values for the variable.
To compute the frequency distribution, select the Descriptive Statistics > Frequencies command from the Analyze menu.`
First, we move the variable wrkslf to the Variable(s) list box. Second, click on the OK button to produce the output.
The variable includes two categories, justifying its use as a categorical variable.
Since the variable self-employment [wrkslf] can be used as a categorical variable, we mark the statement as correct.
The second statement asks about the sample size requirements. We can use the frequency distribution to get the number and percentage of cases in each category.
The sample size is large enough to make the sampling model for the sample proportions approximately normal based on the Central Limit Theorem if there are 10 or more cases in both the target category for the confidence interval and the other category in the distribution of the variable. There were 32 in the category "self-employed". With 250 valid cases in the distribution, the number of cases in the other category was 218. Both groups used to compute the confidence interval had the required minimum of 10 cases. The sample size requirement is satisfied.
Both groups used to compute the confidence interval had the required minimum of 10 cases. The sample size requirement is satisfied. Mark the check box for a correct answer.
The next question asks us about the 95% confidence interval. SPSS does not compute the confidence interval for a proportion. We will use Excel to calculate the confidence interval.
To compute the confidence interval in Excel, we need two items of information from the SPSS frequency table: • The valid percent in the target category • The total number of valid cases
When you open the Excel workbook ConfidenceIntervalForProportions.xls, you will see the following. Directions for using the worksheet are shown in rows 1 and 2. Unless you unprotect the worksheet, the only cells you can enter data in are B4 and B6. The worksheet includes the formulas for all three of the confidence intervals of interest: 90%, 95%, and 99%.
This view shows the formulas that were entered in each of the orange cells that calculate the results. You should not have to change them.
When cells B4 and B6 are empty, this is what the worksheet will look like.
Next, we enter data from the frequency table to compute the interval. The proportion of survey respondents who were self-employed was 0.128. The proportion of survey respondents in the categories other than self-employed was 0.872 (1.00 - 0.128).
I entered the number of valid cases from the SPSS frequency table. To compute the standard error based on the sample proportion, we multiply the proportion in the category (0.1280) times the proportion in other categories (0.8720), divide by the number of valid cases (250), and compute the square root of the result [square root(0.1208 x 0.8702 ÷ 250) = 0.0211].
For a 95% confidence interval, we compute the margin of error by multiplying the standard error by 1.96 (1.96 x 0.0211 = 0.0414).
The lower bound of the 95% confidence interval is computed by subtracting the margin of error from the proportion in the target category (0.1280 - 0.0414 = 0.0866). The upper bound of the 95% confidence interval is computed by adding the margin of error to the proportion in the target category (0.1280 + 0.0414 = 0.1694).
The lower bound of the 95% confidence interval is 0.0866 (or 8.7%). The upper bound of the 95% confidence interval is 0.1694 (or 16.9%). The statement that "we can be 95% confident that between 8.7% and 16.9% of all survey respondents were self-employed" is correct. Mark the check box for a correct answer.
If we violate the level of measurement or sample size requirement, it not appropriate to compute the confidence interval. In this case, we would mark “None of the above.”
Variable can be treated as categorical? Do not mark check box. No Problem will state target category. All other categories are combined into “other” category. Mark only “None of the above.” Stop. Mark statement check box. 10+ subjects in target and other categories? Do not mark check box. No Yes Yes Mark only “None of the above.” Stop. Mark statement check box.
Confidence interval stated correctly? Do not mark check box. No Stop. We do not mark “None of the above” because level of measurement and sample size should be marked if we got to this step. Mark statement check box. Yes