Ventilation-Perfusion Relationships
Ventilation-Perfusion Relationships. Module I. Objectives. At the end of the module you will: State how the / ratio is derived. State the normal value for / ratio. List the 4 types of / relationships. Explain how RQ is calculated and what the normal value is.

Ventilation-Perfusion Relationships
E N D
Presentation Transcript
Ventilation-Perfusion Relationships Module I
Objectives At the end of the module you will: • State how the/ratio is derived. • State the normal value for/ratio. • List the 4 types of /relationships. • Explain how RQ is calculated and what the normal value is. • Given an Alveolar ventilation and a cardiac output, calculate the /ratio. • List the clinical conditions or disease states that cause the following: • Low/ ratio • High /ratio
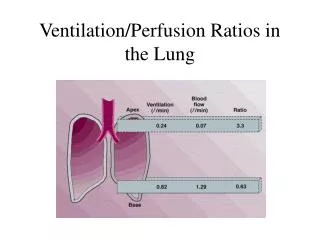
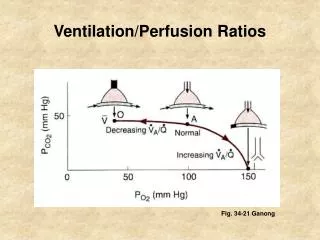
Ventilation-Perfusion Ratio • Normal Alveolar minute ventilation (A) is about 4 L/min • Normal Cardiac Output (T) is about 5 L/min • Ventilation-Perfusion Ratio = A/T • Normal value is (4 L/min)/(5 L/min) = 0.8 • Varies in upright lung because ventilation and perfusion varies within the lung. • Blood flow & Ventilation are both greatest at the bases, BUT they are not equally distributed. • Blood Flow > Ventilation at the bases – /is < 0.8 • Ventilation > Blood flow at the apices – / is > 0.8
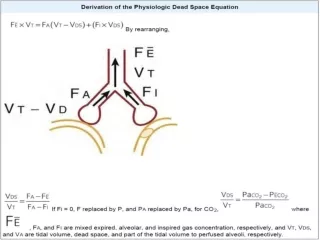
/, PAO2 and PACO2 • Alveolar oxygen (PAO2) determined by the amount of oxygen entering the alveoli and by the amount of oxygen being removed by capillary blood flow. • Alveolar carbon dioxide (PACO2) determined by the amount of carbon dioxide that diffuses into the alveoli from the capillary blood and the amount of carbon dioxide being removed from the alveoli through alveolar ventilation.
Role of / on PAO2 • The amount of ventilation and perfusion affects the amount of oxygen in the alveolus. • As ventilation increases, more oxygen enters the alveolus (PAO2 rises). • As ventilation decreases, less oxygen enters (PAO2 falls). • As perfusion increases, more oxygen leaves the alveolus (PAO2 falls). • As perfusion decreases, less oxygen leaves (PAO2 rises).
Role of / on PACO2 • The amount of ventilation and perfusion affects the amount of carbon dioxide in the alveolus. • As ventilation increases, more carbon dioxide is eliminated (PACO2 falls). • As ventilation decreases, less carbon dioxide is eliminated (PACO2 rises). • As perfusion increases, more carbon dioxide is returned for elimination (PACO2 rises). • As perfusion decreases, less carbon dioxide is returned for elimination (PACO2 falls).
Increased / Ratio • Ventilation exceeds Perfusion (>) • If ventilation exceeds perfusion, more oxygen is coming into alveoli than is being removed by perfusion, so the PAO2 will increase. • If ventilation exceeds perfusion, more carbon dioxide is leaving the alveoli than is returning from the body by perfusion, so the PACO2 will decrease. • The reduced alveolar carbon dioxide level also causes a higher alveolar oxygen level. • Hint: Think of the Alveolar Air Equation
Decreased / Ratio • Ventilation is less than Perfusion (<) • If ventilation is less than perfusion, more oxygen is removed from the alveoli than is being supplied by ventilation, so the PAO2 will decrease. • If ventilation is less than perfusion, more carbon dioxide is returning to the alveoli than is being ventilated off, so the PACO2 will increase. • This relationship is present in the bases.
/ and Capillary Blood Gases • Net effect is a mixing of pulmonary capillary blood gases to the normal level.
Respiratory Quotient • The relationship between the oxygen consumption and the carbon dioxide production is the Respiratory Quotient (RQ). • Normal CO2: 200 ml/min • Normal O2: 250 ml/min • RQ is CO2/O2 • (200 ml/min)/(250 ml/min) or 0.8
Types of / relationship • Ventilation matches perfusion (inbalance with ) • Normal (0.8) • Ventilation exceeds perfusion (>) • Deadspace ventilation (/ > 0.8) • Perfusion exceeds ventilation (<) • Shunted blood (/ < 0.8) • Ventilation and perfusion are both missing • Silent Unit (/???)
Deadspace Ventilation • Ventilation exceeds perfusion • Pulmonary emboli • Reduced blood flow to alveoli • Destruction of pulmonary vasculature (emphysema) • Increased pressure on pulmonary vessels • Overdistension of alveoli
Shunted Blood Flow • Perfusion exceeds ventilation • Obstructive lung disease (due to an overall reduction in ventilation) • Restrictive lung disease (due to reduced lung volumes) • Hypoventilation • Inability of alveoli to remain inflated (surfactant deficiencies)
Calculating / ratios • Given an alveolar ventilation of 6 L/min and a cardiac output of 4 L/min, what is the/ratio? • What type of/relationship does this represent?