Using ArcMap
Using ArcMap. ArcMap. Comprehensive map authoring application Used for all map-based tasks Mapping Editing Query and analysis Creating graphs, reports and outputs. Terminology. Data Frame Contains layers of map data Can have multiple data frames Each data frame has properties

Using ArcMap
E N D
Presentation Transcript
ArcMap • Comprehensive map authoring application • Used for all map-based tasks • Mapping • Editing • Query and analysis • Creating graphs, reports and outputs
Terminology • Data Frame • Contains layers of map data • Can have multiple data frames • Each data frame has properties • Data View • Default view where you do your mapping, analysis, etc. • Can only see one data frame at a time • Right-click/Activate or click/Alt
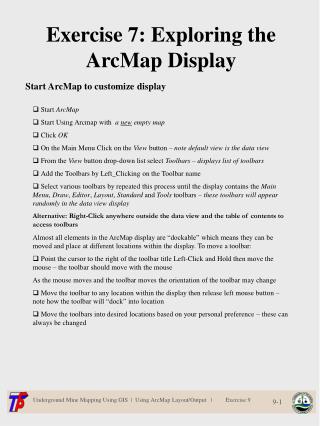
Data Frame Properties • View Data Frame Properties OR Double-click on name
Map Layer Properties • Right-click or double-click on the layer name
Fields Tab • Can limit the fields that are shown when using Identify
Adding Labels to Your Map • Labels • Property of the map layer • Right click on the map and toggle the Label Features option • May not be in the optimal place • Remember to use Identify if it is only for the purpose of querying • Use the Label Manager • Fewer label placement rules • Annotation • Feature class within geodatabase or property of the map • Usually used for print maps
Types of Maps • General Map • Variety of information of equal importance • Not targeting a specific audience (e.g. topographic map) • Subtle symbology • Thematic Map • Focussed • Importance of information can vary on the map • Symbology can dominate • Qualitative (no importance in terms of size) vs quantitative (size differences)
Choropleth Maps • uses ranges or graduated colours to map data for administrative areas • Derived from the Greek words choros = space and pleth = value • Shading is used to denote an increase or decrease in a value • Should technically only plot standardised values (e.g. percentages, ratios) or the maps may be misleading • Problems of MAUP/ecological fallacy
Graphs/Charts • Pie charts, Bar charts, Stacked bar charts • Need more than one variable
ArcMap Properties • Arcmap Tools Options • Make newly added layers visible by default – OFF • Return to last used location when Add dialog first used – ON • Rendering behaviour on window resize - NO redraw
Map Documents • When you are working, you load different maps, change symbology, create some new maps, etc. • You can save your work as a Map Document (.mxd) • You can then click on the .mxd file and it will load ArcMap and all your files • The .mxd DOES NOT contain the data • It is a pointer to the data + all your settings • Can use absolute or relative pathnames (specify in File Document Properties)
Saving Layer Properties • Save layer properties for repeated use • Data is not saved with the properties • Can save this as an .mxd but do not always work in the same map document • Definition file (.lyr) that defines the properties that you have set for that layer (e.g. symbols, labels, joins, etc.) • Can load a combination of different layer files without creating each map from scratch
Styles • Captures the symbol, text, etc. from a map document • Tools Styles • Style Manager • Export Style
Bookmarks • Stored in the map document • Can only be accessed from a single map document • Holds the spatial extent of your map • Zoom in + View Bookmarks Create • Give the bookmark a meaningful name • View BookMarks Name you gave it • Each data frame contains its own list of bookmarks
Viewing Windows • Window Overview, Magnifier Windows permit efficient navigation and efficient editing
Making Maps with ArcMap • Hands-on Exercise #3