Regional Inversion Analysis of North American CO2 Fluxes: Insights from 2004 Measurements
This study presents an inter-comparison of regional inversion results for CO2 fluxes in North America, focusing on data from 2004. The analysis highlights the variability in atmospheric CO2 concentrations, the importance of continuous measurement data, and comparisons between top-down and bottom-up models. By examining different inversion setups and boundary conditions, the research assesses their impacts on estimated fluxes. The findings underscore the necessity for community consensus on inversion methodologies and improved transport models to enhance our understanding of carbon cycling.

Regional Inversion Analysis of North American CO2 Fluxes: Insights from 2004 Measurements
E N D
Presentation Transcript
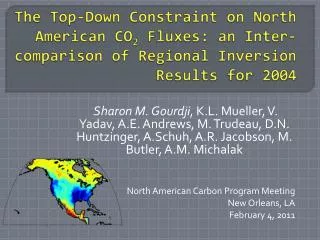
The Top-Down Constraint on North American CO2 Fluxes: an Inter-comparison of Regional Inversion Results for 2004 Sharon M. Gourdji, K.L. Mueller, V. Yadav, A.E. Andrews, M. Trudeau, D.N. Huntzinger, A.Schuh, A.R. Jacobson, M. Butler, A.M. Michalak North American Carbon Program Meeting New Orleans, LA February 4, 2011
Atmospheric inversions Measurement locations Variability in atmospheric CO2 concentrations provides information about surface CO2 exchange Inversions potentially useful for validating bottom-up models and verifying emission reductions
Continuous, continental measurement data (Relatively) recent availability of continuous, continental measurement data necessitates improvements in inversions and transport models to appropriately use this data (Source: http://www.esrl.noaa.gov/gmd/ccgg/)
Model inter-comparison • Use 2004 for comparison because large availability of (top-down and bottom-up) model results • Inversion inter-comparisons help to highlight impact of setup choices & assumptions on estimated fluxes • Compare estimates at multiple scales • Grid-scale spatial patterns • Biome-scale seasonal cycle • Annual aggregated budgets
Atmospheric data constraint over North America in 2004 • High sensitivity area shown here, where minimum level of sensitivity to measurements throughout year 2004 yearly-average sensitivity of measurements to fluxes from WRF-STILT Can identify areas well-constrained by atmospheric measurements using footprint analysis
Forward models Click here to play movie Biospheric flux, June to August, 2004 • Compare inversions to 16 forward models estimating North American biospheric fluxes in 2004 • Collected for the North American Carbon Program Regional Interim Synthesis mmol/(m2*s)
Grid-scale (March to May) Can see influence of explicit priors Sources around LEF visible in 5 of 6 inversions; spatial extent of impact varies NARR inversion similar to forward model mean
Grid-scale (June to August) Inversions look similar during height of growing season, and most correspond closely with forward model mean
Grid-scale (September to November) Strong sources in center of continent from all inversions relative to forward model mean; most visible in UMich “no prior” inversion
Grid-scale (December to February) • Stronger sources in UMich than other inversions • Fossil fuel inventory? Data choices? Boundary conditions?
Comparison to other inversions Some convergence in UMich inversions & CarbonTracker Differences in timing & magnitude of peak uptake; spread driven as much by inversion setup as prior assumptions? Inversion spread narrower in well-constrained agricultural regions
Comparison to forward models DLEM EC-MOD Can inversions give insight into forward model spread?
Boundary conditions for regional inversions • Boundary conditions needed to account for influence of fluxes outside North America on measurement data • For geostatistical inversions, test two different sets of boundary conditions • CarbonTracker • GlobalView
2004 continental budget Boundary conditions have strong impact on annual budgets from inversions, regardless of prior assumptions
2004 budget in high sensitivity areas Annual budgets most reliable in high sensitivity areas With GlobalView boundary conditions, inversions show weak sinks similar to majority of forward models
Conclusions • Large spread in inversion results for 2004; need for: • Community consensus on optimal setup (grid-scale vs. big regions, covariance assumptions, priors, etc.) and data choices • More research into correct boundary conditions • Will more data increase or decrease model spread? • Results less sensitive to inversion setup? • Or more difficult to use new kinds of data (e.g. very short towers, urban sites, complex terrain, satellite column-averages?) • Improvements in transport models needed to reduce risks in using new datastreams • Important to understand “simple” inversions using in situ databefore incorporating satellite measurements into sophisticated data assimilation systems
Acknowledgements WRF-STILT: AER, Inc. (JanuszEluszkiewicz, Thomas Nehrkorn, John Henderson), John Lin, DeyongWen Atmospheric data providers: NOAA, Doug Worthy, Bill Munger, Marc Fischer NACP Regional Interim Synthesis team and modelers Funders: NASA (ROSES NACP and NESSF fellowship)
QUESTIONS? Contact: sgourdji@umich.edu