Download
1 / 27
270 likes | 379 Vues
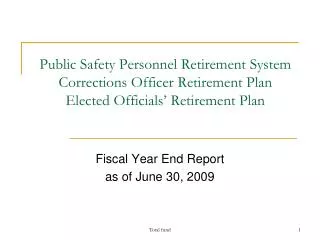
This report provides a detailed overview of the Public Safety Personnel Retirement System, including corrections officers' retirement plans and elected officials' retirement plan statistics as of June 30, 2009. It outlines key metrics such as active members (35,304), terminated vested members (2,740), and total revenue with a reported net loss of $595,929,593. The report also discusses the investment portfolio's performance against various benchmarks and future implications for funding levels and employer contribution rates related to post-retirement adjustments.

E N D
Public Safety Personnel Retirement SystemCorrections Officer Retirement PlanElected Officials’ Retirement Plan Fiscal Year End Report as of June 30, 2009 Total fund
Active Members35,304 Terminated Vested Members 2,740 Drop 1,044 Retired 12,105 Normal 9,105 Beneficiaries 1,681 Disability 1,319 Total Participants 51,193 Total Plan StatisticsDefined Benefit Plan Total fund
Total RevenueJune 30, 2009 Total Net Loss ($595,929,593) Total fund
Total ExpensesJune 30, 2009 Total Expenses $578,609,862 Total fund
Net Cash FlowFYE June 30 (thousands) EE-ER Contributions – Benefits Payments and Expenses Footnote: Transfer of 2,200 probation, surveillance and juvenile detention officers into CORP on July 1, 2007 increased cash flow for FYE 2008. Additionally, there was a decrease in retirements from the DROP program. Total fund
Asset AllocationJune 30, 2009 at Market Total fund
Total Fund – Returns by Asset Class(Fiscal Year 2008-09) Total fund
Annual Index Returns(Fiscal Year 2008-09) *Return is based on 3 month smoothing of NCREIF’s quarterly data. Total fund
Investment Portfolio ReturnsJune 30, 2009 *Returns shown are gross of fees; ** Benchmark 7/1/2008-3/31/2009: 46% Wilshire 5000, 21% MSCI World Ex-US, 20% Lehman Gov/Credit, 6% NCREIF NPI, 6% Wilshire 5000 + 300 bps, 1% 91-Day Treasury Bill; Benchmark 3/31/09-6/30/2009 30% Russell 3000, 20% MSCI World Ex-US, 20% BC Capital Aggregate, 8% NCREIF MPI, 8% Russell 3000+100 bps, 8% ML US High Yield BB-B Rated Constrained, 5% CPI+200 bps and 1% 91-day T-Bill. *** Returns are net of fees. Total fund
Total Fund Performance As of June 30, 2009 • The Total Fund returned -17.45% over the Fiscal Year ending June 30 • Performance was above the benchmark over the fiscal year and while falling shy of the median public fund return • The Total Fund Universe is comprised of Public Funds from the ICC Public Fund Universe and includes over 100 Public Funds over the five full years • Rank shows how the performance of the Total Fund and Benchmark compared relative to other Public Funds Total fund
Total Fund vs. BenchmarkFYE June 30 *Total Fund returns are gross of fees ** Benchmark 7/1/2008-3/31/2009: 46% Wilshire 5000, 21% MSCI World Ex-US, 20% Lehman Gov/Credit, 6% NCREIF NPI, 6% Wilshire 5000 + 300 bps, 1% 91-Day Treasury Bill; Benchmark 3/31/09-6/30/2009 30% Russell 3000, 20% MSCI World Ex-US, 20% BC Capita Aggregate, 8% NCREIF MPI, 8% Russell 3000+100 bps, 8% ML US High Yield BB-B Rated Constrained, 5% CPI+200 bps and 1% 91-day T-Bill.
Funding Levels Total fund
PSPRS – Aggregate Employer Rates *The aggregate computed contribution rates before application of the statutory minimum Total fund
CORP – Aggregate Employer Rates Total fund
EORP – Employer Rates Total fund
Total Fund Changing Financial Status (in 000s) *Market value does not include future benefit increase reserve Total fund
PSPRS Changing Financial Status(in 000s) *Market value does not include future benefit increase reserve Total fund
CORP Changing Financial Status (in 000s) *Market value does not include future benefit increase reserve Total fund
EORP Changing Financial Status (in 000s) *Market value does not include future benefit increase reserve Total fund
Implications for the Future • Employer Rates • Post Retirement Benefit Increase Reserves (after cost of July 1, 2009 post retirement adjustment) • PSPRS:$285,613,717 (July 1 adjustment = $125.7M) • CORP: $15,124,946 (July 1 adjustment = $18.1M) • EORP: $3,637,670 (July 1 adjustment = $11.3M) • 7-1-10 Future Increase Amount is contingent upon assets flowing into account. Total fund
Post-Retirement Adjustment Reserve Balances Total fund
Asset Allocation Total fund
Employer Contribution Rates Total fund
Impact of Assumption Changes Total fund
Investment ExpenseFYE June 30 (% of Assets) *“Comparison of costs to the universe must be interpreted with extreme caution given the breadth of the universe which encompasses funds with widely varying size and asset mix. Your benchmark cost calculation, is a much more valuable indicator as to whether you are a low or high cost producer since it adjusts for differences in fund size and asset mix.” Cost Effectiveness Measurement Inc, 2006 pg 12 Total fund