Download
1 / 35
350 likes | 988 Vues
Innovative Bioremediation Demonstrations of Petroleum Contaminated Sites in Poland and US. PERF Meeting at LBNL March 10,1999. Terry C. Hazen Earth Sciences Division Lawrence Berkeley National Laboratory University of California TCHazen@lbl.gov www-esd.lbl.gov/ERT/ert.html.

E N D
Innovative Bioremediation Demonstrations of Petroleum Contaminated Sites in Poland and US.PERF Meeting at LBNL March 10,1999 Terry C. Hazen Earth Sciences Division Lawrence Berkeley National Laboratory University of California TCHazen@lbl.gov www-esd.lbl.gov/ERT/ert.html
U.S. Department of Energy-Poland Initiative • The mission of U.S. DOE and the Polish Institute for Ecology of Industrial Areas (IETU) Katowice, Poland partnership is to establish the Risk Abatement Center for Eastern and Central Europe (RACE). • IETU/RACE in cooperation with the U.S. team will demonstrate the U.S. DOE process for investigation, evaluation and remediation of a hazardous waste site. • 1995-7: Characterization and demo of biosparging/bioventing bioremediation of oil refinery waste lagoon at the Czechowice Oil Refinery. • A goal is to provide a mechanism for the transfer of those techniques and technologies used in the demonstration to Poland and other countries in the region. • The Initiative will provide for the advancement of EM technologies for use at other DOE facilities and promote commercial development between U.S. and Polish environmental firms.
OBJECTIVES • Demonstrate Cost Effective Remediation of Czechowice Oil Refinery (COF) Lagoon by: • Reducing the risks associated with both the soil and lagoon water. (Risk Assesment must determine an acceptable level.) • Remediate to a level which will support a green zone (i.e. Grow grass.) • Train and Transfer Bioremediation technology to the IETU, Poland, and RACE. • Evaluate the technology deployed for effectiveness and cost efficiency, eg. compare passive vs. active aeration. • Transfer technology gleaned (isolates) to DOE sites.
Biodegradation Rates: Bioventing vs. Prepared Bed Prepared Bed Bioventing • Various (Bartha, 1986) 52-641 • SRS 10-107 10-65 • Italy (biopile - crude) 60 • Hill AFB, Utah 10 • Tyndall AFB, Florida 2-20 • The Netherlands 2-5 • The Netherlands 8 • Patuxent River NAS, Maryland 3 • Fallon NAS, Nevada 5 • Eicklson AFB, Alaska 1-10 • Kenai, Alaska 21 • Tinker AFB, Oklahoma 2.7-18 *all values in mg/kg/day
Czechowice Oil Refinery • The Silesian Refinery Works, known as the Czechowice Oil Refinery started in 1896 when the Schodnica refinery was built. • A second refinery was built in 1902 by the Vacuum Oil Company which was owned by the Socony Vacuum Oil Company Inc., New York USA. • The first distillation unit was built in 1931 by Foster Wheeler. • The refinery was bombed by the Allies in 1943 and partially rebuilt by the Germans during the war. • Polish engineers and workers finished the restoration shortly after the war and production resumed in 1946. • Cresol was refined into grease with a capacity of 25,000 tons/yr. • Between 1959 and 1962 capacity increased to 500,000 tons/yr. • Thallic and turpentine oils processing was added in 1985. • Today’s free market products include ethyl gasoline, engine oil , fuel oil, paraffins, asphalts, and special oils.
Treatability Test Results • Indigenous microbes that degrade contaminants are present • Microbes present can be stimulated to degrade contaminants at high rate (90% reduction of TPH in <21 days) - IETU and SRTC • 36 Low pH (<3) organisms that degrade contaminants have been isolated (unique atributes make them patentable) • High clay content of some soils shows even higher stimulation than low clay content soils • Biodegradation of contaminants is correlated with increased CO2 production • pH adjustment is not as important for stimulation as nutrients (N&P) • Local dolomite can be used to increase pH • Local wood chips can be used to provide bulking agent • 36 isolates of unique acidophilic PAH degraders undergoing identification and molecular characterization in FY98.
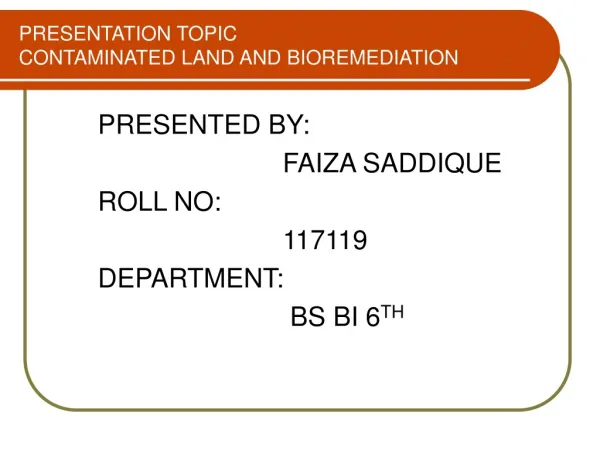
Precipitation (and Oxygen) passive aeration Wastewater Treatment Baroball Fertilizer (N & P) Volatilization Evaporation Outside Wall to be Lowered Surface run-off Top Soil CO2 H2O Methanotrophic bacteria Storm Drain Subsurface irrigation Root Exudates Gas PAH degrading bacteria & fungi water activity gradient Leachate gradient PAH/Oil Contaminated Soil enzyme activity gradient Temperature gradient Eh gradient Solubilization PAH degrading bacteria & fungi Street Gas Migration Transport Dolomite Layer Ditch Methanotrophic bacteria Leachate Collection Gas Injection clay Leachate Perched water table Unsaturated zone Natural Attenuation clay Ground Water Table Layers of reduced permeability Saturated aquifer groundwater flow
COLUMN EXPERIMENT COLUMN A - ACTIVELY AERATED + COMMERCIAL FERTILIZER COLUMN B - ACTIVELY AERATED + NH4NO3 + TEP COLUMN C - ACTIVELY AERATED + NH4NO3 + (NH4)3PO4 COLUMN D - PASSIVELY AERATED + COMMERCIAL FERTILIZER
Expedited Site Characterization • An expedited site characterization of the Czechowice Oil Refinery waste lagoon was performed by Ames Laboratories • Quantitative laboratory analyses as well as qualitative field techniques such as Cone Penetrometer based florescence probes, ground penetrating radar and horizontal well drilling was used to provide a physical and chemical characterization of the site. • BTEX, PAH and Metals were selected as target compounds based on the operating history of the refinery. IETU used the results to produce an environmental risk assessment. • The waste lagoons possess a natural clay bottom and no contaminates have been found directly beneath the lagoon. However, BTEX has been found at deeper depths which suggests a separate source.
Risk Assessment Three Scenarios Postulated I - Adult, On-site Future Construction/Remediation Dermal, inhalation & ingestion during work at lagoons. II - Adult, Industrial (I.e. Refinery Worker) Dermal, inhalation & ingestion during associated work at lagoons. III - Adult, On-site Groundwater, Future Irrigation Dermal, inhalation & ingestion from groundwater during work or irrigation.
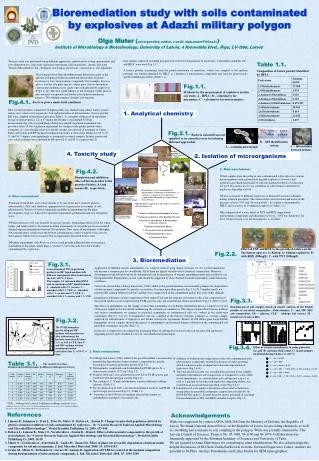
Sampling Main (solid) Nutrients Cell divider Heinjection Air injection Active section Recirculation pump A Sump Lateral (perforated) 14 total A Passive section Aeration/leachate collection system
Sampling points Active section Passive section
Detail A Piezometer (typical) Biopile material (1 - 1.5 M) Cover (20 - 30 cm) Leachate dripping Cell divider Drainage/injection layer (dolomite, 20 - 30 cm) Leachate collection Undisturbed earth Moisture & Temperature Baroball™
Contaminants of concerns - BETX Multi-use Indust. COF Benzene 0.2 100 27.4 Ethylbenzene 1.0 200 3.3 Toluene 1.0 200 14.6 Xylenes 1.0 100 7.3 All values in mg/kg Polish Maximum Contaminant Level (MCL) guidelines (Industrial Use, 0-2 M) (Multiple Use, 0,3-15 M)
TPH Inventory TPH concentration • Average 27.42 g/kg • Minimum <1 g/kg • Maximum 95 g/kg Total TPH inventory158 metric tons
Operating Plan • Initial systems tests (1 week). • Background testing (2-3 weeks). • Respiration test (1 week). • First Operating Campaign (3 months) • no nutrient amendments (dependent on initial tests) • air injection continuous, flow regulated by temperature 40-50°C • Subsequent Operating Campaigns (3 months each) • season differences • nutrient amendments • pulsed air injection • higher and lower flow rates for air injection • higher or lower leachate recirculation rates
Four Operating Campaigns 1. October 97 - January 98: start up and mild aeration 2. February 98 - April 98: intensive aeration 3. May 98 - June 98: aeration, nutrients 4. July 98 - September 98: aeration, nutrients, leachate recirculation
Sample and Analysis • soil microbiology, metals, BETX, TPH, PAH, nutrients, moisture, temperature, pH • soil gases VOC, TPH, PAH, CO2, CH4, O2, pressure • leachate microbiology, TPH, PAH, nutrients, conductivity, BOD, COD, pH
Biodegradation Rates (mg/kg/day) Campaign Average Passive Active OC-1 80 44 119 OC-2 88 82 94 OC-3 < 33 33 0
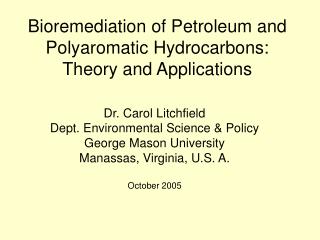
Before After82 metric tons
D Area Oil Seepage Basin 2 trenched horizontal wells at 3 m 1 blower (200 scfm) Methane, N2O, TEP In less than 6 months Methylene Chloride: 2300 ppb to < 2 ppb Vinyl Chloride: 300 ppb to < 5 ppb Dichloroethylene: 100 ppb to < 2 ppb Trichloroethylene: 100 ppb to < 5 ppb Tetrachloroethylene: 50 ppb to <10 ppb BTEX: 50 ppm to < 1 ppm No Action ROD filed 6/98
Aerobic Landfill Bioreactor CO2, O2, CH4 CO2, O2, CH4 Temporary Cover System Leachate Recirculation Pump Air Blower(s) Sanitary Waste Sump CompositeLiner Aquifer (American Technologies Inc., 1997)
Typical Vapor Point 60 CH4 (%) CO2 (%) O2 (%) 50 Degrees C 40 30 20 10 0 1/10/97 1/30/97 2/19/97 3/11/97 3/31/97 4/20/97 5/10/97 5/30/97 6/19/97 7/9/97 7/29/97 8/18/97 (American Technologies Inc., 1997) Date
Landfill Leachate Parameters Parameter Before Injection After Injection BOD (ppm) 1100 17-110 TOC (ppm) 1130 28 Iron (ppm) 110 0.3 Acetone (ppb) 1700 120 MEK (ppb) 690 80 Toluene (ppb) 1500 8 Methylene Chloride (ppb) 250 0 Fecal coliforms (CFU/100ml) 1,950,000 0 Temperature (°F) 60 120-160 Moisture Content (%) 80 95 Leachate Treatment (gal/monthly) 150,000 0 (American Technologies Inc., 1997)
Aerobic Landfill Bioremediation • Demonstrated: • increased biodegradation rate • increased subsidence • eliminated need for leachate treatment • stabilized refuse mass sooner • decreased long-term liability and monitoring costs • decreased leaching of metals and organic contaminants • decreased methane generation • Reduced life cycle costs