Blue Gene System and Performance Overview
300 likes | 534 Vues
Blue Gene System and Performance Overview. Wayne Pfeiffer April 5, 2007. BG/L is the first generation of IBM’s massively parallel, power-efficient Blue Gene architecture. Largest BG/L is at LLNL (installed from 4Q04 to 3Q05) 65,000+ compute nodes (131,000+ processors) in 64 racks

Blue Gene System and Performance Overview
E N D
Presentation Transcript
Blue Gene System and Performance Overview Wayne Pfeiffer April 5, 2007
BG/L is the first generation of IBM’s massively parallel, power-efficient Blue Gene architecture • Largest BG/L is at LLNL (installed from 4Q04 to 3Q05) • 65,000+ compute nodes (131,000+ processors) in 64 racks • Two low-power, 700-MHz PowerPC processors + memory in each node • 3D torus + tree for efficient message passing • Exceptional packaging for compact footprint • Very high peak speed of 367 Tflop/s; #1 Linpack speed of 280 Tflop/s • Over 200 Tflop/s sustained on Qbox materials science application • 1st academic BG/L is at SDSC (installed in 4Q04 & upgraded in 4Q06) • 3,072 compute nodes (6,144 processors) in 3 racks • Peak speed of 17 Tflop/s • Maximum I/O-configuration with 128 I/O nodes/rack for data-intensive computing • Achieved more than 3 GB/s for writes using GPFS • Users need to select applications and problems carefully • Must scale (at least weakly) to many processors (because they’re slow) • Must fit in limited memory (0.5 to 1 GB per node)
Blue Gene offers many pluses +Hardware is much more reliable than for other high-end systems installed at SDSC in recent years + Compute times are extremely reproducible + Networks scale well + I/O performance with GPFS is good (for SDSC’s max I/O-node configuration) + Power efficiency is outstanding (flop/s per W is high), which lowers operating cost + Footprint is small
BG/L has 10x better power efficiency than other leading HPC systems
But there are also some minuses -Processors are relatively slow • Clock speed is 700 MHz • Compilers make little use of second FPU in each processor (though optimized libraries do much better) - Applications must scale well to get high absolute performance - Memory per node is limited, so some problems don’t fit • Coprocessor (CO) mode with 1p/node can be used, but is inefficient (virtual node (VN) mode with 2p/node is preferred) • Some problems still don’t fit even in coprocessor mode
First rack of Blue Gene system at SDSChas lots of gigabit Ethernet cables
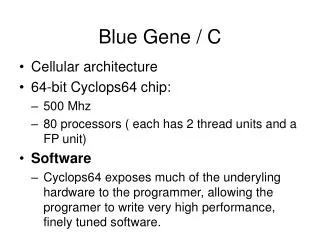
Description of BG/L processor chip(= System-on-a-chip) • Two 700-MHz PowerPC 440 processors (=cores) • Each with two floating-point units that are not independent • Each with 32-kB L1 data caches that are not coherent • 4 flops/proc-clock peak (=2.8 Gflop/s per processor) • 2 8-B loads or stores / proc-clock peak in L1 (=11.2 GB/s per processor) • Shared 2-kB L2 cache (or prefetch buffer) • Shared 4-MB L3 cache • Five network controllers (though not all wired to each node) • 3D torus (for point-to-point MPI operations: 175 MB/s nom x 6 links x 2 ways) • Tree (for most collective MPI operations: 350 MB/s nom x 3 links x 2 ways) • Global interrupt (for MPI_Barrier: low latency) • Gigabit Ethernet (for I/O) • JTAG (for machine control) • Memory controller for 512 MB or 1 GB of off-chip, shared memory • 5.6 GB/s peak memory bandwidth per node
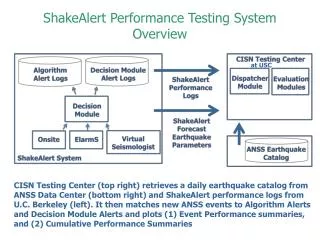
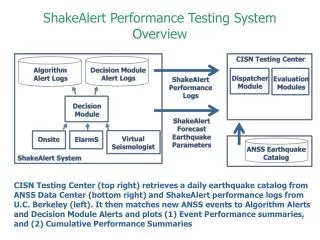
Nodes in SDSC’s three-rack BG system • 3x1024 compute nodes & 3x128 I/O nodes (each with 2p) • Most I/O-rich configuration possible (8:1 compute:I/O node ratio) • Identical hardware in each node type with different networks wired • Compute nodes connected to: torus, tree, global interrupt, & JTAG • I/O nodes connected to: tree, global interrupt, Gigabit Ethernet, & JTAG • Two half racks (also confusingly called midplanes) • Connected via link chips • Front-end nodes (3 B80s [default], each with 4 Power3-IIs, plus one 4-way Power5 node [bg-login4]) • Service node (Power 275 with 2 Power4+ processors) • Two parallel file systems using GPFS • Shared gpfs-wan serviced by 32 NSD nodes (each with 4 Power5+s) • Local gpfs serviced by 12 NSD nodes (each with 2 IA-64s)
Multiple BG operating systems & functions • Compute nodes: run Compute Node Kernel (CNK = blrts) • Each run only one job at a time • Each use very little memory for CNK • I/O nodes: run Embedded Linux • Run CIOD to manage compute nodes • Perform file I/O • Run GPFS • Front-end nodes: run SuSE Linux • Support user logins • Run cross compilers & linker • Run parts of mpirun to submit jobs & LoadLeveler to manage jobs • Service node: runs SuSE Linux • Uses DB2 to manage four system databases • Runs control system software, including MMCS • Runs other parts of mpirun & LoadLeveler
Outstanding performance has been achieved for a wide range of applications on BG/L • Gordon Bell Prize for Peak Performance in 2005 & 2006 • 107 Tflop/s for ddcMD: classical molecular dynamics (on 128k procs) • 207 Tflop/s for Qbox: electronic structure calculation (on 128k procs) • Gordon Bell Prize for Special Achievement in 2006 • 71 Tflop/s for CPS: quantum chromodynamics (on 128k procs) • Many other applications have scaled to multiple Tflop/s on up to 32k or 40k processors • 5.8 Tflop/s for Cactus-GR: general relativity • 11 Tflop/s for HOMME: atmospheric dynamics • 6.1 Tflop/s for AWM: earthquake simulation • 4.7 Tflop/s for DNS: direct numerical simulation of turbulence • …
Good scaling is essential to take advantageof high processors counts • Two types of scaling are of interest • Strong: performance vs processor count (p) for fixed problem size • Weak: performance vs p for fixed work per processor • There are several ways of plotting scaling • Run time (t) vs p • Speed (1/t) vs p • Speed/p vs p • Scaling depends significantly on the computer, application, & problem • Use log-log plot to preserve ratios when comparing computers
The Qbox code scales well on BG/Lwith extremely high processor efficiency • Qbox (http://eslab.ucdavis.edu) is a C++/MPI implementation of First-Principles Molecular Dynamics • Qbox was designed for large-scale parallel operation on BG/L • Qbox scaled to 131,072 processors on LLNL’s BG/L & achieved a sustained performance of 207 TFlop/s 2006 Gordon Bell Prize for Peak Performance Slide from Francois Gygi, UC Davis
Strong scaling of NAMD on BG/Limproves with size of biomolecular system Results from Sameer Kumar, IBM
Many applications have been ported to Blue Gene at SDSC;most run well enough that Blue Gene is attractive
Comparison between Blue Gene at SDSC & DataStar(as representative TeraGrid systems) is of interest • BG at SDSC & DS have comparable peak speeds • 17 Tflop/s for BG • 15 Tflop/s for DS • BG has slower processors • 700-MHz PowerPC processors on BG • 1.5- to 1.7-GHz Power4+ processors on DS • BG/DS clock speed ratio = 0.7/1.5 = 0.47
Speed of Blue Gene relative to DataStar varies about clock speed ratio(0.47 = 0.7/1.5) for applications on ≥ 512p;CO mode is slightly faster than VN mode per MPI proc (more later)
MILC strong scaling is roughly linear on BG & superlinear on DS,presumably because of better cache usage on DS
Tuning of NAMD code (by Sameer Kumar of IBM)has greatly improved absolute speed & strong scaling on Blue Generelative to that on DataStar
If number of MPI processors is considered,then CO mode is usually faster than VN mode,as can be seen from DNS strong scaling scan Results from Dmitry Pekurovsky, SDSC
If number of allocated processors is considered,then VN mode is usually faster than CO mode,as can be seen from DNS strong scaling scan Results from Dmitry Pekurovsky, SDSC
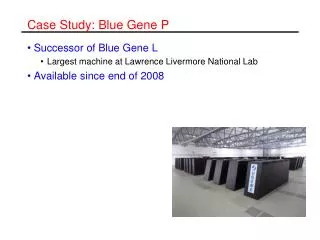
BG/P & BG/Q are next generation modelsof Blue Gene architecture • BG/P • Incremental improvements to BG/L • Target of 1 Pflop/s peak • Expected 2007/2008 • BG/Q • More substantial architectural improvements • Target of at least 10 Pflop/s peak • Expected 2010/2011
Blue Gene is an attractive alternative to DataStar(& other TeraGrid systems)depending upon the application & problem + Many applications scale well + Turnaround is good with fewer users than on other TeraGrid systems + Hardware is reliable & easy to maintain, so interruptions are infrequent - Some applications don’t scale so well - Some problems need to run in CO mode to fit in memory - Other problems won’t fit at all
Blue Gene references • Special Blue Gene issue of IBM Journal of Research and Development, v. 49 (2/3), March/May 2005 www.research.ibm.com/journal/rd49-23.html • Rick Stevens, The LLNL/ANL/IBM Collaboration to Develop BG/P and BG/Q www.sc.doe.gov/ascr/ASCAC/Stevens-ASCAC-March20061.pdf • Francois Gygi, et al., Large-Scale Electronic Structure Calculations of High-Z Metals on the BlueGene/L Platform sc06.supercomputing.org/schedule/pdf/gb104.pdf • Blue Gene Web site at SDSC www.sdsc.edu/us/resources/bluegene