High-Performance Computing with C64 Cellular Architecture Chip
Explore the innovative C64 chip system, exposing much hardware to programmers for high-performance software writing. The system utilizes multi-core SoC technology in a cellular architecture design, achieving over one petaflop peak performance with 13,824 processing nodes. The unique C64 chip configuration integrates 75 processors with custom-designed elements. Learn about the intricate interconnection network system and quality measures of network structures for efficient computing.

High-Performance Computing with C64 Cellular Architecture Chip
E N D
Presentation Transcript
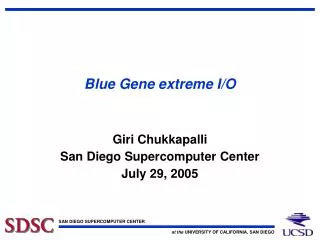
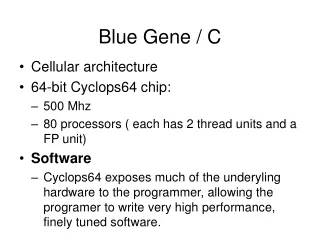
Blue Gene / C Cellular architecture 64-bit Cyclops64 chip: 500 Mhz 80 processors ( each has 2 thread units and a FP unit) Software Cyclops64 exposes much of the underyling hardware to the programmer, allowing the programer to write very high performance, finely tuned software.
The C64 system is a petaflop supercomputer built on multi-core system-on-a-chip (SoC) technology, based on a cellular architecture and expected to achieve over one petaflop peak performance. A maximum configuration of a C64 system consists of 13,824 C64 processing nodes (1million processors) connected by a 3D-mesh network. Each node is composed of a C64 chip, external DRAMs and a small number of external modules. A C64 chip consists of up to 80 custom-designed 64-bit processors (eachconsists of two thread processing cores), 16 shared instructioncaches (I-caches), 160 on-chip embedded SRAM memorybanks and 80 floating point units (FP). It is interestingto note that there is no data cache on the chip. Instead, eachSRAM bank on the chip can be configured into two levels:global interleaved memory banks (GM) which are uniformlyaddressable, and scratch pad memories (SP) that arelocal to individual processors . The C64 chip configuration used in this study integrates75 processors on a single chip. Each processor containstwo thread units, one floating point unit and two 32KBSRAM memory banks. Groups of five processors share oneI-Cache.
Interconnection NetworkSystem = Processor Tiles + Channels + Routers
Router Architecture • Input-queued • Virtual Channel • Speculative Pipeline
Switches Low-swing bit lines • Operate at channel rate • Reduces area and hence power • Equalized drive • Buffered crosspoints • Integral allocation
The most important quality measures of aninterconnection network are its : 1. Degree - the maximum degree of all PUs; 2.Diameter - the maximum distance between any pair of PUs in the network. 3.Bisection width, the minimum number of connections that must be removed in order to decompose a processor network with n PUs into two networks with at most round_up(n / 2) PUs.
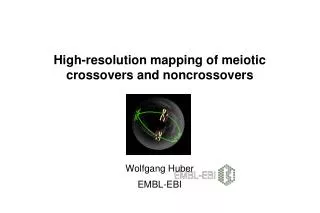
Comparison of the diameter (D) and average diameter (Dm)of toruses, fat-trees and circulant graphs (Project SWISS) 1.Toruses always have the worst diameter 2.Fat-trees appear to have the best diameter but the difference with circulant graphs is decreasing with increasing degree; 3.The average diameter of fat-trees is very close to its diameter, as a consequence, for degrees greater than 4 and a size smaller than 1000, the average diameter of circulant graphs is smaller than the one of fat-trees; 4.For a number of PUs up to 1000 the diameter of circulant graphs is smaller or equivalent to the one of fat-tree as soon as the degree is greater than 6; 5.Fat-trees always have the best bisectional width, toruses the worst ones, and the bisectional width of circulant graphs is very erratic.
Comparison of the bisectional width of toruses, fat-trees and circulant graphs Based on these results we can discard the toruses that always have the worst diameter and bisectional width. Small degree fat-trees seem to be the best choice even if the difference with circulant graphs is not spectacular. Nevertheless, the drawback of fat-tree is that they are extremely rigid. We have the following properties • The number of fat-trees of a given degree d and of size N is equal to <N. For d=8 and N=1000 this number is equal to 3; • Performant circular graphs can be found for any number of PUs.
Comparison of the bisectional width of toruses, fat-trees and circulant graphs
Building up systems with several hundred blocks requires building a matrix of high-speed, high-fanout fat-tree switches to interconnect the processors. Courtesy Compaq Computer Corporation, Manchester, U.K.
To understand how technology changes affect the optimal network radix, consider the latency (T ) of a packet traveling through a network. The header latency (Th) is the time for the beginning of a packet to traverse the network and is equal to the number of hops a packet takes times a per hop router delay (tr). Since packets are generally wider than the network channels, the body of the packet must be squeezed across the channel, incurring an additional serialization delay (Ts). Thus, total delay can be written as T = Th + Ts = Htr + L/b (1) where H is the number of hops a packet travels, L is the length of a packet, and b is the bandwidth of the channels. For an N node network with radix k routers (k input channels and k output channels per router), the number of hops must be at least 2logkN. Also, if the total bandwidth of a router is B, that bandwidth is divided among the 2k input and output channels and b = B/2k.
Substituting this into the expression for latency from equation (1) T = 2tr logk N + 2kL/B (2) Then, setting dT/dk equal to zero and isolating k gives the optimal radix in terms of the network parameters, k log2k =Btr logN/ L (3) Router delay tr can be expressed as the number of pipeline stages (P) and times the cycle time (tcy). As radix increases, tcy remains constant and P increases logarithmically. The number of pipeline stages P can be further broken down into a component that is independent of the radix (X)and a componentwhich is dependent on the radix (Y log2k). Thus router delay (tr) can be rewritten as tr = tcyP = tcy(X + Y log2 k)` (4)
Radix Clos Rank 2 Network Latency Latency = H tr + L / b= 2trlogkN + 2kL / B where k = radix B = total router Bandwidth N = number of nodes L = message size