Download
1 / 46
460 likes | 792 Vues
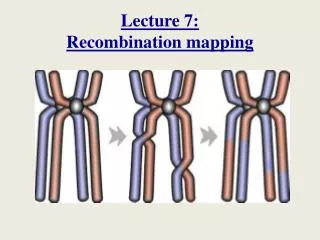
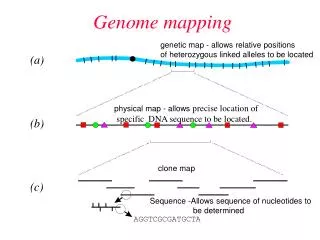
Fine Mapping of Complex Traits in Yeast: Mapping Meiotic Recombination across the Genome. Wolfgang Huber EMBL - EBI. Proper chromosome segregation. Increase of genetic diversity. Gene A. Gene B. Gene C. Gene A. Gene b. Gene c. Gene a. Gene b. Gene c. Gene a. Gene B. Gene C.

E N D
Fine Mapping of Complex Traits in Yeast: Mapping Meiotic Recombination across the Genome Wolfgang Huber EMBL - EBI
Proper chromosome segregation • Increase of genetic diversity Gene A Gene B Gene C Gene A Gene b Gene c Gene a Gene b Gene c Gene a Gene B Gene C Meiotic Recombination
second end capture dHJ noncrossover crossover DSBR Model of Recombination DSB strand resection 3’ 3’ single-end invasion D-loop
SDSA invading strand unwound 3d CO pathway nicked HJ crossover noncrossover Current Molecular Model of Recombination DSB strand resection 3’ 3’ single-end invasion D-loop DSBR second end capture dHJ crossover MC Whitby (2005)
female average male Non-Random Distribution of Recombination Across the Genome Human chr. 22q Yeast chr. 3 Petes T.D., 2001 Baudat F. & Nicolas A., 1997 Recombination hotspots are small genomic regions where recombination events cluster and that are surrounded by large stretches of recombinationally suppressed DNA
The common lab yeast Clinical strain (YJM789) Laboratory strain (S288c) Clinical isolates of S. cerevisiae Isolated from rotten fig in California in 1930s Domesticated: related to baker's yeast, wine-making and beer-brewing yeasts Isolated from immuno-compromised patients Pathogenic in mouse model of systemic infection Various fungal pathogenic characteristics: pseudohyphae, colony morphology switching Ability to grow at >>37˚C – a virulence trait
SNP Genome I A C G A T G Genome II A C G G T G Hybridization Genome II Hybridization Genome I C C A A C C C G G C G G C C C G C G C G G G C T T C C G G T T T A A A A T A T A A A T A A T T A G G G G A A A A T T T T C C C C G G G G T T T T Genotyping with Microarrays Perfect Match Mismatch
common S-specific Y-specific 1 tiling array for 2 yeast genomes * 5’ 3’ Watson strand 8bp * 3’ 5’ Crick strand 4bp 25mer 10% 4% 86% S288c YJM789 291k 2,368k 108k Wei et al., PNAS (2007) 3.4 Mio probes (25mers) manufactured by Affymetrix (probes)
Identification of previously unknown ncRNA and antisense transcripts and precise mapping of all transcripts Antisense CBF1 David et al., PNAS (2006)
Map all recombination events that occurred in 50 yeast meioses using high-density tiling microarrays
Experimental Approach S288c YJM789 Diploid hybrid Meiosis Haploid spores Data: 25 parental hybridizations, 200 offspring hybridizations
Single-reporter methods De novo polymorphism detection • Winzeler et al.Science 281, 1998 (and others): ANOVA testing 1 = 1. • Borevitz et al.Genome Research 13, 2003: moderated t-test (SAM). • Brem et al. Science 296, 2002: moderated t-test, then cluster all data (parental and segregant) and discard SFPs for which clusters don’t separate the parental data. • Segregant genotyping (using polymorphims) • Use the estimated posterior probability of class membership (uniform prior on the classes): • Brem et al. augment this: are estimated from clustered data.
But we have multiple reporters per SNP: probe sets 6: CTTCACTATTTGTACAGATCGCAAT 5: CTAACTTCACTATTTGTACAGATCG Probe set: a set of reporters that exactly + uniquely map to a location and interrogate one polymorphism 4: GGCCCTAACTTCACTATTTGTACAG 2: GACTGGCCCTAACTTCACTATTTGT 1: GGAGGACTGGCCCTAACTTCACTAT S96: CCTCCTGACCGGGATTGAAGTGATAAACATGTCTAGCGTTA YJM789: CCTCCTGACCGGGATTGAACTGATAAACATGTCTAGCGTTA 3: GACTGGCCCTAACTTGACTATTTGT
Multivariate analysis of probe set dataparallel coordinate plots log2 intensity reporters in probe set
Multivariate analysis of probe set dataparallel coordinate plots
Multivariate methods SNPScanner: Gresham et al., Science 311, 2006: • Model probe intensity xi with & without presence of SNP as function of • Probe GC content • Position of SNP within the probe • Nucleotides surrounding the SNP • Fit model parameters using two sequenced strains with known SNPs. • To genotype a segregant or new strain at a given base, compute a Bayes factor assumption: covariance matrix diagonal and same
But • neighbouring probes' data are not independent • covariances for the two genotypes are often quite different • training data is often not representative • SNPscanner method generates too many wrong calls • a generalized multi-probe method
GT-SSC: a semi-supervised, model-based genotyping algorithm An instance of EM algorithm: • Two-component mixture, 1 = 2 = 1/2. • (Xi,Yi) with array data Xi and class variable Yi. Yi known for parental arrays, unknown for segregants. • Assume X|Y multivariate normal. • E-step: initialize the unknown Y with some simple clustering, e.g. k-means, hierarchical agglomeration • Iteratively estimate parameters, E(Yi|Xi), parameters, …. • Classify segregant i based on final estimated E(Yi|Xi).
GT-SSC (genotyping by semi-supervised clustering) An instance of the EM algorithm applied to multivariate Gaussian mixture modeling: simutaneously estimate class shapes and object class membership
GT-SSC (genotyping by semi-supervised clustering) An instance of the EM algorithm applied to multivariate Gaussian mixture modeling: simutaneously estimate class shapes and object class membership
GT-SSC (genotyping by semi-supervised clustering) An instance of the EM algorithm applied to multivariate Gaussian mixture modeling: simutaneously estimate class shapes and object class membership R package ss.genotyping
Filtering ambiguous individual genotype calls Aberrant probe sets Weakly separating probesets Imbalanced probesets Probe Sets Genotype Calls
Segregation of 55,987 Markers in a Tetrad 1 marker every 214 bp S288c YJM789 Marker genotypes along chromosome
Fine structure of meiotic breakpoints 4657 crossovers, 2766 conversions across 50 meioses.
Complex events Crossover plus two conversion tracts - suggests that a single NCO resolution can produce evidence on both involved strands
Complex events Four overlapping conversion tracts.
General characteristics Crossover Conversion Size (bp) 1.8% - 4.5% of genome is part of recombination events in a single meiosis (up to 544 Kb) Every chromosome had at least one crossover event
Evidence for different positional preferences of CO and NCO events HIS4
Implications of A Conversion Hotspot:Non-monotonous relationship between genetic and physical map tightly linked less tightly linked proximal sequence has greater genetic distance than distal sequence conversion hotspot
Recombination hotspots have lower density of SNPs across S. cerevisiae strains Recombination hotspots vs. SNP density (window = 2000) Fraction of significant recombination hotspots Recombination counts SNP density (Sanger unpublished)
Interference Zki8 Spo11 Spo11 Zki8 Zip4 Zip2 Zip3 Rad50 Mre11 Xrs2 Zip1 Zip1 Dmc1/Rad51 Mer3 SDSA DSBR Msh4/Msh5 Mus81 Mms4 Mlh1 Mlh3 crossover crossover noncrossover
Crossover interference is reduced in msh4 mutant 40-60 kb 60-80 kb Distance between adjacent crossovers (bp)
Conclusions Used high-density tiling arrays to resequence >50 tetrads (>200 spores) from crossing of two phenotypically diverse strains 1.8% - 4.5% of genome is part of recombination events in a single meiosis (up to 544 Kb) Recombination hotspots show evidence of allelic homogenization Crossover interference extends for 60-80 kb in wildtype and is reduced in msh4 mutant Conversion rates are unaffected in msh4 mutants questioning homeostasis between crossovers and conversions
Acknowledgements • EBI • Alessandro Brozzi • David Jitao Zhang • Elin Axelsson • Ligia Bras • Tony Chiang • Audrey Kauffmann • Greg Pau • Oleg Sklyar • Mike Smith • Jörn Tödling EMBL HD Lars Steinmetz Julien Gagneur Zhenyu Xu Sandra Clauder-Münster Fabiana Perocchi Wu Wei Eugenio Mancera Ramos Richard Bourgon • The contributors to R and Bioconductor projects
%DSB DSBs Map Baudat F. & Nicolas A., 1997 SGD Map cM/Kbp Kbp www.yeastgenome.org Comparison of Recombination Maps crossover conversion Our Maps count
Benchmark SNPScanner - GTS • 233 Affymetrix yeast tiling arrays from Steinmetz group: 13 S288, 12 YJM789: training data 52 tetrads of crosses: to be genotyped • Same post-processing/filter
GT-SSC vs SNPScanner arrays genomic position (markers)