FINE SCALE MAPPING
This outline discusses fine scale mapping of disease loci leveraging high-density SNP haplotype data in a Bayesian framework. It provides insights into gene trees, the coalescent process, and challenges posed by genetic heterogeneity. Using cystic fibrosis as a case study, it highlights mapping complexities, such as the known ΔF508 mutation and ancestral haplotypes. The document also introduces Bayesian approaches for estimating disease locus locations amidst SNP variations, aiming to refine candidate regions and enhance genetic association studies.

FINE SCALE MAPPING
E N D
Presentation Transcript
FINE SCALE MAPPING ANDREW MORRIS Wellcome Trust Centre for Human Genetics March 7, 2003
Outline • Introduction: fine scale mapping using high-density SNP haplotype data. • Bayesian framework. • Gene trees and the coalescent process. • Genetic heterogeneity and shattered gene trees. • Markov chain Monte Carlo (MCMC) algorithm. • SNP genotype data. • Example: cystic fibrosis.
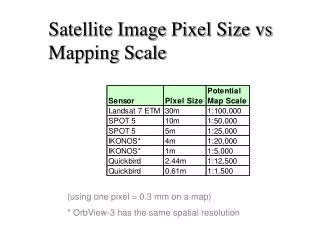
Introduction • Candidate region of the order of 1Mb in length. • Refine location of putative disease locus within region. • Make use of high-density maps of single nucleotide polymorphisms (SNPs). • Type sample of affected cases and unaffected controls.
Once upon a time… • Disease predisposition determined by single locus in candidate region. • Each case chromosome carries a copy of a disease allele, resulting from a single recent mutation event at disease locus. • Each control chromosome carries a copy of the ancient normal allele at the disease locus.
In an ideal world… • Excess sharing of SNP haplotypes in the vicinity of the disease locus, among cases and not among controls. • Decreased probability of sharing as distance from disease locus increases. • Approximate location of disease locus inferred.
Problems… • Gene tree and ancestral haplotypes are unknown. • Marker mutations lead to mismatch of alleles within preserved regions. • Multiple disease genes, multiple mutations, and dominance.
Example: Cystic fibrosis (CF) • Fully penetrant recessive disorder, incidence ~1/2500 live births in white populations, less common in other populations. • Preliminary linkage analysis suggested 1.8Mb candidate region for a single CF gene on chromosome 7q31. • More recently, a 3bp deletion, ΔF508, has been identified in the CFTR gene at ~0.88Mb into the candidate region. • Now known that ΔF508 accounts for ~66% of all chromosomal mutations in individuals with CF. • Remainder of CF chromosomes carry copies of many other rare mutations in the same gene. • 23 RFLPs used to identify haplotypes in 92 control chromosomes and 94 case chromosomes, 62 of which have been confirmed to carry ΔF508.
Challenges… • The ΔF508 locus does not lie at the centre of the region of high LD. • Non-ΔF508 case chromosomes are not expected to share the same founder marker haplotype. • Useful test-data set for fine-scale mapping methods…
Challenges… • The ΔF508 locus does not lie at the centre of the region of high LD. • Non-ΔF508 case chromosomes are not expected to share the same founder marker haplotype. • Useful test-data set for fine-scale mapping methods…
Bayesian framework (1) • Assume disease locus exists in candidate region: aim is then to estimate its location. • Approximate the posteriordistribution of location. • Allows assignment of probabilities that disease locus lies in any particular area of the candidate region.
Bayesian framework (2) • Aim is to approximate the posterior density of location of the disease locus, given SNP haplotypes in cases A and controls U, denoted f(x|A,U). • Depends on other model parameters M, including gene tree, population haplotype frequencies, etc… • Recover marginal posterior density by integration over these nuisance parameters, f(x|A,U) = ∫f(x,M|A,U)dM
Bayesian framework (3) • By Bayes’ Theorem… f(x,M|A,U) = C f(A,U|x,M) f(x,M) • Normalising constant. • Likelihood of haplotype data given model parameters M and location x. • Prior density of M and x.
Bayesian framework (3) • By Bayes’ Theorem… f(x,M|A,U) = C f(A,U|x,M) f(x,M) • Normalising constant. • Likelihood of haplotype data given model parameters M and location x. • Prior density of M and x.
Bayesian framework (3) • By Bayes’ Theorem… f(x,M|A,U) = C f(A,U|x,M) f(x,M) • Normalising constant. • Likelihood of haplotype data given model parameters M and location x. • Prior density of M and x.
Bayesian framework (3) • By Bayes’ Theorem… f(x,M|A,U) = C f(A,U|x,M) f(x,M) • Normalising constant. • Likelihood of haplotype data given model parameters M and location x. • Prior density of M and x.
Control chromosomes • Assumed to carry an ancient normal allele at the disease locus. • Effects of recent shared ancestry of less importance, so simple model assumed: f(A,U|x,M) = f(A|x,M) f(U|h) • The likelihood, f(U|h), depends only on population SNP haplotype frequencies, h. • For many SNPs, the number of possible haplotypes is large, so frequencies are parameterised in terms of allele frequencies and first-order LD between pairs of adjacent loci.
Gene trees • Representation of the recent shared ancestry of case chromosomes at the disease locus. • Star shaped tree: each case chromosome descends independently from founder. Assumes there is too much information in sample about ancestral recombination and mutation events. • Bifurcating tree: shared ancestral recombination and mutation events between chromosomes appear only once in their shared ancestry.
Gene trees • Representation of the recent shared ancestry of case chromosomes at the disease locus. • Star shaped tree: each case chromosome descends independently from founder. Assumes there is too much information in sample about ancestral recombination and mutation events. • Bifurcating tree: shared ancestral recombination and mutation events between chromosomes appear only once in their shared ancestry.
Tree specification • Topology T: the branching pattern of the tree. • Branch lengths, τ, determined by the waiting times, w, between merging events in the gene tree. • Scaled in units of 2N generations, where N is effective population size. Root Leaf nodes
Prior probability model • Uniform prior probability model for population haplotype frequencies, the location of disease locus, and the effective population size. • Each gene tree topology has equal prior probability. • Prior probability model reduces to: f(x,M) = C f(w) • Need prior probability model for waiting times between merging events.
The coalescent process (1) • Time between merging event from k to k-1 lineages. • Scaled in units of 2N generations. • Exponential distribution with rate k(k-1)/2.
The coalescent process (1) • Time between merging event from k to k-1 lineages. • Scaled in units of 2N generations. • Exponential distribution with rate k(k-1)/2. Exponential: rate 8x7/2 = 28 Expected time: 0.0357
The coalescent process (1) • Time between merging event from k to k-1 lineages. • Scaled in units of 2N generations. • Exponential distribution with rate k(k-1)/2. Exponential: rate 7x6/2=21 Expected time: 0.0476
The coalescent process (1) • Time between merging event from k to k-1 lineages. • Scaled in units of 2N generations. • Exponential distribution with rate k(k-1)/2. Exponential: rate 2x1/2=1 Expected time: 1
The coalescent process (2) • Assumes constant effective population size, N. • Flexible: can allow for exponential population growth and population sub-structure. • Assumes sample is ascertained at random from the population. Problem: case chromosomes ascertained because they carry a copy of the disease mutation. • Assumes sample has single common ancestor. Problem: genetic heterogeneity.
The shattered coalescent model • Generalisation of the coalescent process to allow branches of the gene tree to be removed. • Introduce indicator variable, zb, for each node, b, taking the value 1 if b has a parent in the gene tree and 0 otherwise. • Allows for singleton leaf nodes, corresponding to sporadic case chromosomes, and disconnected sub-trees, corresponding to independent mutation events at the same disease locus. • Assume number of branches of gene tree not removed in the shattered coalescent process given by binomial distribution, with shattering parameterρ.
Ancestral haplotypes • Haplotypes, I, carried by internal nodes of the gene tree are unknown. • To calculate posterior probability, need to integrate over distribution of possible ancestral haplotypes, which depends on gene tree and other model parameters. • Treated as augmented data in Bayesian framework: enters posterior probability through likelihood… f(x|A,U) = ∫ ∫ f(x,M,I|A,U)dMdI and… f(x,M,I|A,U) = C f(A,U,I|x,M) f(x,M)
Likelihood calculations • If node has no parent in shattered gene tree, treat as a random chromosome from the population (sporadic or founder for mutation). • If node has parent in genealogy, depends on marker haplotype carried by the parental node, and the occurrence of recombination and mutation events along the connecting branch.
Likelihood calculations • If node has no parent in shattered gene tree, treat as a random chromosome from the population (sporadic or founder for mutation). • If node has parent in genealogy, depends on marker haplotype carried by the parental node, and the occurrence of recombination and mutation events along the connecting branch.
MCMC algorithm (1) • Need to calculate joint posterior distribution f(x,h,T,w,z,N,ρ,I|A,U). • Parameter space extremely complex, so cannot be calculated analytically. • Markov chain Monte Carlo (MCMC) algorithm approximates the posterior distribution by sampling from f(x,h,T,w,z,N,ρ,I|A,U). • Computationally intensive, but becoming more practical with improvements in computing power. • Can handle missing SNP data: treat as augmented data in the same way as ancestral haplotypes.
MCMC algorithm (2) • Let S denote current set of model parameters {x,h,T,w,z,N,ρ,I}. • Propose “small” change to model parameters, S*. • Accept S* in place of S with probability f(S*|A,U)/f(S|A,U). • If S* is not accepted, the current parameter S is retained. • Initial burn-in to allow convergence of f(S|A,U) from random starting parameter set. • Subsequent sampling period, parameter set recorded every rth step of the algorithm: each recorded output represents a random draw from f(S|A,U).
MCMC algorithm (3) Tree height Location ρ N 101 0.47374 2557.62766 4.24189612 10849.19083 0.78104 -1769.51173 102 0.40629 2112.19993 4.16846454 8804.63049 0.79777 -1788.66623 103 0.46534 1679.71719 4.30423786 7229.90233 0.75364 -1854.19049 104 0.48211 2229.24788 4.33740414 9669.14899 0.78009 -1763.70173 105 0.43808 2402.10599 4.29011844 10305.31919 0.82178 -1760.56671 106 0.44607 2275.33453 4.03331587 9177.14285 0.82601 -1775.90300 107 0.41822 3016.70273 4.39000994 13243.35496 0.77768 -1844.20629 108 0.40934 2534.50113 4.07270615 10322.27832 0.81590 -1861.97411 109 0.41032 3122.91416 4.25386813 13284.46504 0.82479 -1814.27448 110 0.45020 3209.14218 4.34316471 13937.83307 0.78422 -1801.44160 Log posterior probability
MCMC algorithm (3) Tree height Location ρ N 101 0.47374 2557.62766 4.24189612 10849.19083 0.78104 -1769.51173 102 0.40629 2112.19993 4.16846454 8804.63049 0.79777 -1788.66623 103 0.46534 1679.71719 4.30423786 7229.90233 0.75364 -1854.19049 104 0.48211 2229.24788 4.33740414 9669.14899 0.78009 -1763.70173 105 0.43808 2402.10599 4.29011844 10305.31919 0.82178 -1760.56671 106 0.44607 2275.33453 4.03331587 9177.14285 0.82601 -1775.90300 107 0.41822 3016.70273 4.39000994 13243.35496 0.77768 -1844.20629 108 0.40934 2534.50113 4.07270615 10322.27832 0.81590 -1861.97411 109 0.41032 3122.91416 4.25386813 13284.46504 0.82479 -1814.27448 110 0.45020 3209.14218 4.34316471 13937.83307 0.78422 -1801.44160 Log posterior probability
Cystic fibrosis: revisited • Assume a fixed recombination rate of 0.5cM per Mb and a marker mutation rate of 2.5 x 10⁻⁵ per locus, per generation. • Each run of MCMC algorithm begins with 20,000 step burn-in period: thrown away. • Subsequent 200,000 step sampling period, output recorded every 50th step of the algorithm: 4000 outputs. • Two analyses of CF data performed: control chromosomes (92) and (i) ΔF508 case chromosomes (62) only; (ii) all case chromosomes (94).