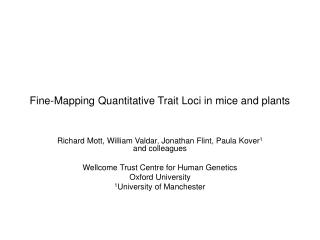
Fine-Mapping Quantitative Trait Loci in mice and plants
940 likes | 1.2k Vues
Fine-Mapping Quantitative Trait Loci in mice and plants. Richard Mott, William Valdar, Jonathan Flint, Paula Kover 1 and colleagues Wellcome Trust Centre for Human Genetics Oxford University 1 University of Manchester. Inbred founders. Mosaic Crosses. G3. G N. F20. inbreeding. mixing.

Fine-Mapping Quantitative Trait Loci in mice and plants
E N D
Presentation Transcript
Fine-Mapping Quantitative Trait Loci in mice and plants Richard Mott, William Valdar, Jonathan Flint, Paula Kover1 and colleagues Wellcome Trust Centre for Human Genetics Oxford University 1University of Manchester
Inbred founders Mosaic Crosses G3 GN F20 inbreeding mixing chopping up Heterogeneous Stock, Advanced Intercross, Random Outbreds F2, diallele Recombinant Inbred Lines
Analysis of Mosaic Crosses Observed chromosome structure (genotypes) Hidden Markov Model Hidden Chromosome Structure (ancestral mosaic) Mott et al, 2000 PNAS
Heterogeneous stocks C3H/HeJ LP/J CBA/J A/J C57BL/6J AKR/J BALB/cJ DBA/2J Pseudo-random mating for 50 generations
Collaborative Cross Mice 8-way funnel C57BL6/J A/J WSB/EiJ NOD/LtJ 129S1/SvImJ NZO/HlLtJ CAST/EiJ PWK/PhJ Brother-sister mating for >20 generations ~ 1000 Recombinant Inbred Lines
Genetic diversity of mouse populations Roberts et al Mamm Genome (2007) 18:473-481 The diversity captured in the model resources is shown in their respective color as (BXD RI, blue; B.P CSS, gray; Northport HS, green; LSDP, orange; CC, red).
Study design • 2,000 heterogeneous stock mice • 15,000 diallelic markers • More than 100 phenotypes • each mouse subject to a battery of tests spread over weeks 5-9 of the animal’s life
101 Phenotypes • Anxiety (conditioned and unconditioned tasks) [24] • Asthma (plethysmography) [13] • Biochemistry [15] • Diabetes [16] • Haematology [15] • Immunology [9] • Weight/size related [8] • Wound Healing [1] • Bacterial Gut Flora • Mandible Shape • Gene Expression • Hippocampus, Liver, Lung
How to select peaks: a simulated example Simulate 7 x 5% QTLs (ie, 35% genetic effect) + 20% shared environment effect + 45% noise = 100% variance
Peaks from 1D scan phenotype ~ covariates + ?
1D scan: condition on 1 peak phenotype ~ covariates + peak 1 + ?
1D scan: condition on 2 peaks phenotype ~ covariates + peak 1 + peak 2 + ?
1D scan: condition on 3 peaks phenotype ~ covariates + peak 1 + peak 2 + peak 3 + ?
1D scan: condition on 4 peaks phenotype ~ covariates + peak 1 + peak 2 + peak 3 + peak 4 + ?
1D scan: condition on 5 peaks phenotype ~ covariates + peak 1 + peak 2 + peak 3 + peak 4 + peak 5 + ?
1D scan: condition on 6 peaks phenotype ~ covariates + peak 1 + peak 2 + peak 3 + peak 4 + peak 5 + peak 6 + ?
1D scan: condition on 7 peaks phenotype ~ covariates + peak 1 + peak 2 + peak 3 + peak 4 + peak 5 + peak 6 + peak 7 + ?
1D scan: condition on 8 peaks phenotype ~ covariates + peak 1 + peak 2 + peak 3 + peak 4 + peak 5 + peak 6 + peak 7 + peak 8 + ?
1D scan: condition on 9 peaks phenotype ~ covariates + peak 1 + peak 2 + peak 3 + peak 4 + peak 5 + peak 6 + peak 7 + peak 8 + peak 9 + ?
1D scan: condition on 10 peaks phenotype ~ covariates + peak 1 + peak 2 + peak 3 + peak 4 + peak 5 + peak 6 + peak 7 + peak 8 + peak 9 + peak 10 + ?
1D scan: condition on 11 peaks phenotype ~ covariates + peak 1 + peak 2 + peak 3 + peak 4 + peak 5 + peak 6 + peak 7 + peak 8 + peak 9 + peak 10 + peak 11 + ?
In 1000 bootstraps… Bootstrap Posterior Probability (BPP)
Model averaging by bootstrap aggregation • Choosing only one model: • very data-dependent, arbitrary • can’t get all the true QTLs in one model • Bootstrap aggregation averages over models • true QTLs get included more often than false ones • References: • Broman & Speed (2002) • Hackett et al (2001)
BPP > 0.25 strong evidence for a QTL 81 diabetes QTLs http://gscan.well.ox.ac.uk Valdar et al (2006) Nature Genetics
Mouse and human T2D candidates Zeggini et al (2007) Science
Bacterial Gut Flora • Different inbred strains have different gut flora (David Threadgill) • Flora can be assayed from feacal boli (quantitative PCR) • Bacteroides distasonis • Clostridium • Eubacterium plexicaudatum • Firmcutes • Flexistipes • Lactobacillus acidophilus • Lactobacillus salivarius • Data available for 600 HS mice at present
Defensins Beta-defensin cluster
QTLs and Gene Expression Networks Direct correlation Complex Phenotypes Gene Expression Phenotypes 47,000 probes 500 hippocampi 250 livers 250 lungs 100 traits 2000 HS mice eQTL QTL Genotypes 13800 SNPs 2000 mice + 300 parents