Quantitative trait locus (QTL) mapping
How can we identify the genes and molecules responsible for phenotypic differences within and between species?. Quantitative genetics: direct mapping of genes in crosses between species or divergent strains within species Unbiased and does not require prior knowledge


Quantitative trait locus (QTL) mapping
E N D
Presentation Transcript
How can we identify the genes and molecules responsible for phenotypic differences within and between species? Quantitative genetics: direct mapping of genes in crosses between species or divergent strains within species Unbiased and does not require prior knowledge Offers conclusive proof of a gene's involvement Species must be able to hybridize You have to develop genetic markers and maps Hard to go from map position to single gene Comparative developmental biology: using our knowledge of developmental biology and molecular genetics to test evolutionary hypotheses Most direct route from phenotype to molecules Does not require species to be crossable or closely related Requires good knowledge of development Special tools and techniques must often be developed Hard to go from correlation to functional proof
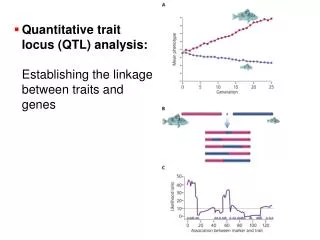
Quantitative trait locus (QTL) mapping Most traits in nature are controlled by multiple genes and therefore vary in a quantitative fashion To map the genes responsible for this variation, we need: 1. Identify pure-breeding lines (or species) that differ in the trait of interest 2. Develop a large number of molecular markers throughout the genome 3. Cross these lines, then cross F1 offspring to each other or to one of the parental strains 4. Genotype F2 progeny for each marker 5. Determine which markers are linked to the trait, and how strongly 6. Infer QTL positions based on this information
What does it take to map QTLs with high resolution? Highest resolution is required for identification and cloning Mapping procedure: 1. Identify pure-breeding lines (or species) that differ in the trait of interest 2. Develop a large number of molecular markers throughout the genome 3. Cross these lines, then cross F1 offspring to each other or to one of the parental strains 4. Genotype F2 progeny for each marker 5. Determine which markers are linked to the trait, and how strongly 6. Infer QTL positions based on this information Factors affecting power and precision: Lines should differ as much as possible Lines (species) should be able to hybridize Marker density should be very high Number of progeny should be very large For polygenic traits, very sophisticated math & software are required
What can QTL mapping tell us? Easy (relatively): How many genes contribute to phenotypic differences? What are the contributions of individual genes? Key question: are evolutionary changes due to many genes of small effect, or to few genes of large effect? 100 genes that contribute 1% each, or 4 genes that contribute 25% each? Very hard: What are these genes??? (TFs, enzymes, etc.) What are their normal developmental/biochemical functions? Why do changes in these genes cause phenotypic differences? What are these changes at the molecular level? (coding or non- coding, how many mutations per gene, etc.)
How many genes are responsible for phenotypic differences between species? These are sibling species!
How many genes are responsible for phenotypic differences between species? These are sibling species!
How strong are phenotypic effects of individual genes? Allen Orr's theoretical prediction Note the log scale In practice, we are only likely to find these Conclusion: genes of large effect do play an important role in phenotypic evolution, but our technical limitations may lead us to overestimate this role
Why is it so hard to identify QTLs? Factors affecting power and precision: Lines should differ as much as possible Lines (species) should be able to hybridize Marker density should be very high (expensive) Number of progeny should be very large (expensive) Often incompatible There have been hundreds of QTL mapping studies in a variety of organisms Hundreds or thousands of QTLs have been detected and roughly mapped But, only a handful of genes (< 20 total?) have ever been identified at the molecular level So what can we do about this?
So what can we do about this? Identification of QTLs can be made much easier if we already know something about the developmental and biochemical basis of the trait OK, so we know the responsible gene is somewhere in the red interval. Now, how do we identify it? 1. Map it with ever-increasing resolution until we reach single-gene density (positionalcloning- long and expensive but certain) 2. Test specific genes that are located in that interval and that might be responsible for the trait based on their molecular function (candidate gene approach - fast and cheap but uncertain).
Pelvic spine reduction in sticklebacks Spined (marine) Spineless (freshwater) This transition has occurred many times in stickleback evolution during independent transitions from marine to freshwater habitats Many changes have occurred in the last 10,000 years (after glaciation)
QTL mapping of pelvic spine reduction Candidate genes known to be involved in appendage development in all vertebrates Note that the mapping is very crude
Pitx1 expression in the pelvic spine region is lost in freshwater sticklebacks
Combining experimental and comparative information We don't know the mutant phenotype of Pitx1 in sticklebacks But, we know what its phenotype is in mice, and it is consistent with its expression pattern in sticklebacks The combination of these two lines of evidence suggests that changes in Pitx1 contribute to phenotypic differences
What happened to Pitx1? Pitx1 is expressed in multiple tissues Its expression is controlled by separate tissue-specific regulatory sequences The coding sequence of Pitx1 is unchanged But it is no longer expressed in the pelvic girdle in spineless fish Its expression in other tissues is unchanged Hypothesis: Mutations in the tissue-specific regulatory sequence are the cause of phenotypic divergence
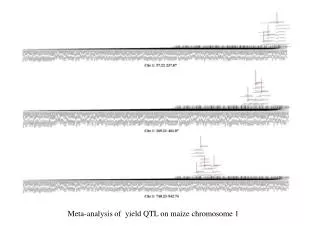
The tb1 gene underlies a major difference in growth pattern between corn and teosinte Wild-type maize Maize tb1 mutant Wild-type teosinte Last 10,000 years!
The difference in branching architecture between maize and teosinte maps near the tb1 locus
tb1 is expressed at a higher level in maize than in teosinte Maize and teosinte alleles were introgressed into the same genetic background tb1 expression in axillary meristems and stamens of the ear primordia is required to suppress branching Hypothesis: increased expression of tb1 in maize is responsible for the architectural differences between maize and teosinte (Northern blots, normalized by ubiquitin)
Selection has been limited to the non-coding region Directional selection has removed most variation in maize No evidence of selection
Are candidate genes responsible for interspecific differences?
Are candidate genes responsible for interspecific differences?
ovo/shavenbaby controls denticle pattern in the larval epidermis
Divergence of svb expression is responsible for differences between D. melanogaster and D. sechellia D. melanogaster D. sechellia
Genetic analysis and mapping of divergent phenotype D. sechellia D.mel svb x D.sec D.mel svb D.mel x D.sec
A very simple trait: Excretory system in C. elegans excretory duct cell lin-48 expression ces-2 mutant lin-48 mutant wild type longer duct
Genetic control of excretory duct development in C. elegans Length of ED wild-type wild-type C. elegans mutants C. elegans coding sequence controlled by C. elegans regulatory sequence C. elegans coding sequence controlled by C. briggsae regulatory sequence
Derived excretory system morphology in C. elegans species strain Length of ED derived morphology!
Derived excretory system function in C. elegans Derived function Salt resistance
Divergence of lin-48 cis-regulatory regions known regulator of lin-48
Evolution of lin-48 regulation: alleles from different species introduced into C. elegans The function of regulatory sequences of lin-48 has diverged!
Functional tests: Necessity and Sufficiency Is C. elegans lin-48necessary for elegans-specific morphology? Yes Is C. elegans lin-48sufficient for elegans-specific morphology? Yes
Functional sufficiency tests: Morphology C. briggsae coding sequence controlled by C. elegans regulatory sequence C. briggsae coding sequence controlled by C. elegans regulatory sequence Conclusion: changes map to regulatory, not coding, sequences
Functional sufficiency tests: Physiology Necessary… … but not sufficient
From observation to testable hypothesis Comparative analysis can suggest candidate genes that may be responsible for phenotypic changes However, candidate gene hypotheses cannot be tested without functional assays These assays can take the form of either genetic crosses (where hybridization is possible) or transgenic tests
Changes in development need not result in morphological changes Changes in development need not result from genetic changes
Dobzhansky - Muller incompatibilities and developmental drift Reproductive isolation and speciation are caused by accumulation of genetic differences among independently evolving populations. Accumulation of genetic differences does not necessarily result in phenotypic divergence “Co-adaptation” of accumulated genetic changes is disrupted in hybrids, leading to inviability or sterility Speciation is due to the evolution of developmental pathways
Developmental incompatibility in Xyphophorus hybrids Xiphophorus helleri Xiphophorus maculatus x X. helleri
Genetic basis of reproductive isolation in Xyphophorus Tu consists of two RTK genes, Xmrk1 and Xmrk2 Xmrk1 is found in all Xyphophorus species Xmrk2 has evolved by exchange/fusion of Xmrk1 and D (donor) locus Xmrk2 is present only in some species, including X. Maculatus The two Xmrk genes are very similar in sequence, but Xmrk is controlled by a D-derived enhancer Xmrk1 is expressed at a low level in all tissues; Xmrk2 is expressed at a high level only in hybrid melanomas Xmrk2 overexpression in non-hybrid fish causes melanic tumors In X. maculatus strains that do not induce melanomas, Xmrk2 is disrupted r = cdk2 ???