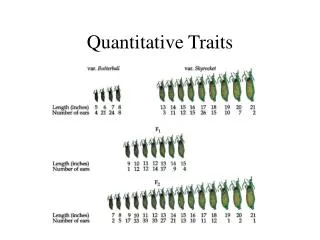
An integrated statistical framework for mapping quantitative traits in mice
An integrated statistical framework for mapping quantitative traits in mice. Richard Mott Jonathan Flint Wellcome Trust Centre for Human Genetics, Oxford Richard.Mott@well.ox.ac.uk. Outline. Introduction QTL Mapping Multiple Phenotype Heterogeneous Stock Experiment

An integrated statistical framework for mapping quantitative traits in mice
E N D
Presentation Transcript
An integrated statistical framework for mapping quantitative traits inmice Richard Mott Jonathan Flint Wellcome Trust Centre for Human Genetics, Oxford Richard.Mott@well.ox.ac.uk
Outline • Introduction • QTL Mapping • Multiple Phenotype Heterogeneous Stock Experiment • Testing for Functional Variants • Expression Data • Future
Genetic Traits • Quantitative (height, weight) • Dichotomous (affected/unaffected) • Factorial (blood group) • Mendelian - controlled by single gene (cystic fibrosis) • Complex – controlled by multiple genes*environment (diabetes, asthma)
Quantitative Trait Loci QTL: Quantitative Trait Locus chromosome genes
Quantitative Trait Loci QTL: Quantitative Trait Locus chromosome QTG: Quantitative Trait Gene
Quantitative Trait Loci QTL: Quantitative Trait Locus chromosome QTG: Quantitative Trait Gene QTN: Quantitative Trait Nucleotide
Disease studied directly Population and environment stratification Very many SNPs (1,000,000?) required Hard to detect trait loci – very large sample sizes required to detect loci of small effect (5,000-10,000) Potentially very high mapping resolution – single gene Very Expensive Animal Model required Population and environment controlled Fewer SNPs required (~100-10,000) Easy to detect QTL with ~500 animals Poorer mapping resolution – 1Mb (10 genes) Relatively inexpensive Map inHumans or Animal Models ?
Inbred founders Mosaic Crosses G3 GN F20 inbreeding mixing chopping up Heterogeneous Stock, Advanced Intercross, Random Outbreds F2, diallele Recombinant Inbred Lines
Sizes of Behavioural QTL in rodents (% of total phenotypic variance)
Mapping Resolution • F2 crosses • Powerful at detecting QTL • Poor at Localisation – 20cM • Too few recombinants • Increase number of recombinants: • more animals • more generations in cross
Heterogeneous Stocks • cross 8 inbred strains for >10 generations
Heterogeneous Stocks • cross 8 inbred strains for >10 generations
Heterogeneous Stocks • cross 8 inbred strains for >10 generations 0.25 cM
Multiple Phenotypes measured on a Heterogeneous Stock • 2000 HS mice (Northport, Bob Hitzeman) 84 families 40th generation • 150 traits measured on each animal • Standardised phenotyping protocol • Covariates Recorded • Experimenter • Time/Date • Litter • Microchipping
Phenotypes • Anxiety (Conditioned and Unconditioned Tests) • Asthma (Plethysmography) • Diabetes (Glucose Tolerance Test) • Haematology • Immunology • Biochemistry • Wound Healing (Ear Punch) • Gene Expression • ….others….
Genotyping • 15360 SNPs genotyped by Illumina • 2000 HS mice • 300 HS parents • 8 inbred HS founders • 500 other inbreds • www.well.ox.ac.uk/mouse/snp.selector • 13459 SNPs successful • 99.8% accuracy (parent-offspring)
Distribution of Marker Spacing (chromosome X) (9 Markers)
LD Decay with distance 99.2% marker pairs on different autosomes have R2 < 0.05.
Genetic Drift in HS • 40 generations of breeding • Allele Frequency in founders will drift • 8% of genome fixed
Analysis • Automated analysis pipeline • R HAPPY package • Single Marker Association • Each phenotype analysed independently • Transformed to Normality, outliers removed • Tailored set of covariates • Linear models for most phenotypes • Survival models for latency phenotypes
Twisted Pair Analysis of Heterogeneous Stock chromosome markers • Want to predict ancestral strain from genotype • We know the alleles in the founder strains • Single marker association lacks power, can’t distinguish all strains • Multipoint analysis – combine data from neighbouring markers alleles 1 1 2 1 2 1 1 1 2 2 1 2 2 1 1 1 1 2 1 1 2 1 1 1 1 1 2 2 1 2 1 2 1 1
Twisted Pair Analysis of Heterogeneous Stock chromosome markers • Hidden Markov model HAPPY • Hidden states = ancestral strains • Observed states = genotypes • Unknown phase of genotypes • Analyse both chromosomes simultaneously • Twisted pair of HMMs • Mott et al 2000 PNAS alleles 1 1 2 1 2 1 1 1 2 2 1 2 2 1 1 1 1 2 1 1 2 1 1 1 1 1 2 2 1 2 1 2 1 1
Testing for a QTL • piL(s,t) = Prob( animal i is descended from strains s,t at locus L) • piL(s,t) calculated by HMM using • genotype data • founder strains’ alleles • Phenotype is modelled E(yi) = Ss,tpiL(s,t)T(s,t) + mi Var(yi) = s2 • Test for no QTL at locus L • H0: T(s,t) are all same • ANOVA partial F test
Genome Scan • Additive and dominance models • Record all peaks that exceed 5% genome-wide significance, • Threshold based on 200 permutations • 9000 preliminary candidate QTL found
Jointly Significant QTL • Forward selection over candidate QTL • Test each QTL conditional on other QTL • Rescan genome conditional on selected QTLs to identify new QTL • 5% genome-wide significance threshold • Bootstrap residuals to find QTL confidence regions
Results • ~7 jointly significant QTL per phenotype • 95% Confidence Interval ~ 2 Mb • ~50% of QTL have a significant non-additive component • Only 3 phenotypes were explained by single major QTL • Most phenotypes are complex
Distribution of QTL Effects Mean Effect size 2.7%
Distribution of #Genes under QTL #QTL +20 QTL With > 10 genes #genes
%Variance Explained [% Additive Genetic Variance calculated using 3-generation pedigree data, not genotypes]
A known QTL: HDL HS mapping Wang et al, 2003
New QTLs: two examples • Ear Punch Hole Area Regrowth • wound healing • Cue Conditioning Freeze.During.Tone • measure of fear
Cue Conditioning • Freeze.During.Tone: huge effect, small number of genes chr15 cntn1: Contactin precursor (Neural cell surface protein)
Gene x Environment Gene x Sex • Repeat analysis looking for QTLs that interact with • Gender • Litter number • Season, Month, etc • Experimenter • Compare models E(y) = m + locus + env E(y) = m + locus * env
Gene x Environment • 431 jointly significant GxE QTLs • 27 gene x experimenter, • 81 gene x litter number, • 67 gene x age, • 105 gene x study day • 151 gene x season. • 13% of variation is GxE • 25 GxE QTLs overlapped with original joint QTL • defined as lying within 4Mb of the peak position • 42 GxSex QTLs
Testing for Functional Variants • Is a SNP functional for a trait? • Is a functional assay measured in founders related to a trait? • Gene expression • DNA-Protein binding