Scientific Method Notes
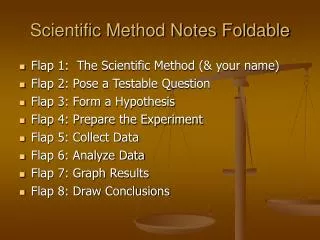
Scientific Method Notes. 8 th Science 2012. Scientific Method Steps. PROBLEM – Puts focus on the purpose of the experiment RESEARCH – Can use formal research methods (book, internet, research or observational study, etc.) or sometimes, only prior knowledge.

Scientific Method Notes
E N D
Presentation Transcript
Scientific Method Notes 8th Science 2012
Scientific Method Steps • PROBLEM – Puts focus on the purpose of the experiment • RESEARCH – Can use formal research methods (book, internet, research or observational study, etc.) or sometimes, only prior knowledge.
3. HYPOTHESIS – Can be in statement form or placed in “IF – THEN” format to accentuate the independent and dependent variables. It is a statement that you THINK is the answer to the problem. This statement MUST be testable.
4. EXPERIMENT – Process of data collection; collected data is put into tables or charts. Should be a controlled experiment when possible. • Control – The part of the experiment that does NOT change… NOT being tested. • Variable – the part of the experiment that changes.
Experiment continued… • Independent Variable – The variable the scientist controls…time intervals, when data is collected, scientists’ actions, etc. • Dependent Variable – The TESTED variable that responds to the scientist’s manipulation…what is being measured.
5. ANALYSIS – Scientist discovers whether or not the data supports the hypothesis. Graphs are used to make calculating and observing data easier to see (Bar, Line, and Pie)
Dry Mix Graphing Method • X Axis – Independent Variable (one scientist controls) • Y Axis – Dependent Variable (one we measured)
6. CONCLUSION – A final decision made about whether or not your hypothesis is supported by data. Options: Test again; not enough information to decide; need more research; hypothesis was correct; or hypothesis incorrect. In all circumstances, the scientist has learned SOMETHING about the problem.
7. COMMUNICATE – This allows the scientist to share information and duplicate results or find new information about the same problem.