Download
1 / 60
600 likes | 772 Vues
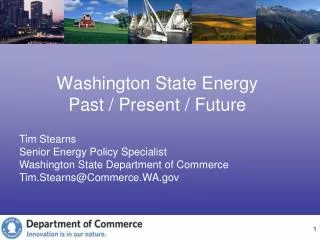
Washington State Energy Past / Present / Future. Tim Stearns Senior Energy Policy Specialist Washington State Department of Commerce Tim.Stearns@Commerce.WA.gov. Ocean energy?. Ocean energy ?. Growth Need Replace Carbon opportunity. Current usage.

E N D
Washington State Energy Past / Present / Future Tim Stearns Senior Energy Policy Specialist Washington State Department of Commerce Tim.Stearns@Commerce.WA.gov
Ocean energy ? • Growth • Need • Replace • Carbon • opportunity
Current usage • 85% world use – fossil fuels – oil/coal/natural gas • 8% nuclear • 7% renewable – biomass/hydroelectric/wind • International Energy Agency – World Energy Outlook – 2008 • 20% renewables by 2020 • 80% carbon reduction by 2050
Energy Environment Economy
“…Americans generally won't acknowledge conflicts and make choices. The cry is for low prices, ample supplies, absolute reliability, clean air, no disfiguring construction projects, local autonomy and national accountability. Great. Unfortunately, there are tensions among all these goals.” Paul Samuelson, Washington Post, August 20, 2003
Washington’s emerging challenges • State grows 130,000 people per year • 1.3 million per decade – double < 50 yr • 273 to house, feed, employ, transport, educate… • 300 new megawatts per year • Can we double system in 50 years? • No new dams sites – 15,000 miles lines • New subdivision – apartment • Car culture – walkable/bikable communities? • Transit additions
Expenditures on Fossil FuelsWashington State: 1999-2008 Excludes fuel taxes, refinery and pipeline costs and profits Sources: EIA, BEA and Sightline
Region Today • 11 million people • Largest hydrosystem • Fossil fuel transportation • imported • Car based • Plenty of inefficiency • Centralized generation • Gas taxes – decline since 1970’s • Future • 20 + million • Integrated system • Clean fuel – biofuels - electric • More Locally produced • Transit and vehicles • Zero energy buildings • Distributed • Move to tolls & mileage charges
Energy is a Big Part of “Greener” Jobs • Green not end • Improve existing uses • Efficiency • Integration • Manage • Cleaner inputs • Home • Food • Transportation • Buildings • Processes
Science of Climate Change is Strong “Most of the observed increase in global average temperatures since the mid-20th century is very likely due to the observed increase in anthropogenic GHG concentrations.” Source: Intergovernmental Panel on Climate Change, 2007 Synthesis Report
WA Greenhouse Gas Emissions (2005) Total = 94.8 million metric tons CO2-equivalent
State Targets - Reduce Emissions Grow Our Economy By 2020reduce GHG emissions to 1990 levels By 2035reduce emissions to 25% below 1990 levels By 2050reduce emissions to 50% below 1990 levels By 2020increase the number of clean energy sector jobs to 25,000 from the 8,400 jobs in 2004 By 2020reduce expenditures by 20% on fuel imported into the state
“Six Americas”—six groups or “publics”beliefs, attitudes, risk perceptions, motivations, values, policy preferences, behaviors and barriers to action 1. Alarmed—16 percent of Americans—are eager to get on with solutions 2. Concerned—29 percent—know climate change is happening, human caused and serious, but they don’t necessarily see the urgency. 3. Cautious—25 percent—happening natural or human-caused. 4. Disengaged—8 percent—have heard of global warming but don’t know 5. Doubtful—13 percent—don’t think it’s happening, or natural. 6. Dismissive—8 percent—convinced not happening, hoax or a plot. Listen - values - motivations common ground.
Energy use ^worldwide • Developing countries • 1.6 b no access • 20% • 1b unreliable • 1 b lack access to safe water
Energy efficiency • America’s highest-priority energy resource • Cheap • Clean • Reliable • Secure * Dispersed * Cheaper new
Key efficiency steps • Building codes • Appliance standards • Integrated design – hvac/light/processes/envelope • Better buildings – zero energy / living buildings
Region built a 4,000 megawatts of efficiency 1980-2010 at an average cost of 2.2 cents – cheaper than wholesale Additional 4,400 average megawatts are available in the Northwest now thru 2030! Growth is about 300 average megawatts per year
Conservation is Cost-effective Under Many Different Future Scenarios Source: NW Power and Conservation Council - Draft 6th Plan
Washington’s First Renewable “Revolution” • Much of WA Post WWII Economy Tied to Inexpensive Renewable Electricity • Aluminum Industry • Defense Industry • Forest Products, Chemical • Rural Electrification
Renewable Portfolio Standards www.dsireusa.org / October 2009 WA: 15% by 2020* ME: 30% by 2000 New RE: 10% by 2017 VT: (1) RE meets any increase in retail sales by 2012; (2) 20% RE & CHP by 2017 MN: 25% by 2025 (Xcel: 30% by 2020) MT: 15% by 2015 • NH: 23.8% by 2025 ND: 10% by 2015 MI: 10% + 1,100 MW by 2015* • MA: 15% by 2020+1% annual increase(Class I Renewables) • OR: 25% by 2025(large utilities)* 5% - 10% by 2025 (smaller utilities) SD: 10% by 2015 WI: Varies by utility; 10% by 2015 goal • NY: 24% by 2013 RI: 16% by 2020 CT: 23% by 2020 • NV: 25% by 2025* IA: 105 MW • OH: 25% by 2025† • CO: 20% by 2020(IOUs) 10% by 2020 (co-ops & large munis)* • PA: 18% by 2020† WV: 25% by 2025*† • IL: 25% by 2025 • NJ: 22.5% by 2021 CA: 33% by 2020 UT: 20% by 2025* KS: 20% by 2020 VA: 15% by 2025* • MD: 20% by 2022 • MO: 15% by 2021 • AZ: 15% by 2025 • DE: 20% by 2019* • NC: 12.5% by 2021(IOUs) 10% by 2018 (co-ops & munis) • DC: 20% by 2020 • NM: 20% by 2020(IOUs) • 10% by 2020 (co-ops) TX: 5,880 MW by 2015 29 states & DChave an RPS 6 states have goals HI: 40% by 2030 State renewable portfolio standard Minimum solar or customer-sited requirement * State renewable portfolio goal Extra credit for solar or customer-sited renewables † Solar water heating eligible Includes non-renewable alternative resources
We’re Number 4! Source : American Wind Energy Assoc. (12.31.09) Texas was all caol / oil / gas / nuclear – price went down
Resource Costs: Long Term Source: NW Power and Conservation Council – Draft 6th Plan
Initiative 937 – Energy Independence Act Sets the Policy Framework for Utility Development of Renewable Electricity 3% of Total Load by 2009 9% by 2012 15% by 2020 State’s large electric utilities must develop conservation plans to acquire all cost effective conservation First plan must be completed by Jan. 1, 2010 and set targets for 2010-2012 biennium
Bioenergy Development • Biodiesel Facilities • Anaerobic Digesters • Research on Alternative Feedstocks • Bioenergy • Biopower • Bioproducts • biofuels • Biomass CHP • Get Beyond waste – less in the landfill
Not in My Backyard ! ! • I Gregoire approves wind-power project Banana - build absolutely nothing anywhere near anything or anyone
Lies, Damn Lies & Statistics Interconnected / competitive / changing world
"In preparing for battle, I have always found that plans are useless, but planning is indispensable." –General Dwight D. Eisenhower
A successful state energy strategy balance goals to: • Maintain competitive energy prices • Meet environmental goals • Be sustainable • Increase competitiveness
Framework for success - alignment • Policy • Mandates - create markets • Tax incentives • regulation • Leverage partners • Private sector • Federal government
Clean Energy Leadership Council • Advisory group of clean energy industry leaders • Charged – How does the state build its clean energy industry? • Four major opportunity areas • Smart Grid • Energy Efficiency • “Green” building and the built environment • Sustainable biomass, biofuels, Bioproducts • Major study by Navigant Consulting – Fall ‘10
Align Core Mission • Grow and improve jobs in Washington • Align Policies and Execution • Policy and Innovation Unit within Commerce • “Sector Lead”
Ocean renewables • Up to 10% of the nation’s energy supply • Hydrokinetic – wave & tidal • Off shore wind • 20% renewables by 2030 • 20% of that from off shore wind • Potential 2500 terra watts of off shore wind – deep • 855 tw 30-60 meters • 603 tw 0-30 meters • Wave 250 tw • Tidal & stream 115 • Current 50 tw • Ocean thermal conversion 89 tw
Issues with Marine energy • End of the line –become on ramps • Washington Coast very deep • Favor floating • Salt water is very harsh environment • Challenge to moor – cables • Immature technologies • High cost compared to alternatives • Resource conflicts • Shipping • Harvesting • Endangered species