Analysis Modeling
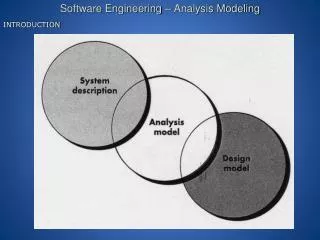
This text explores the essential concepts of analysis and modeling in software development as outlined in Chapter 12 of Pressman's 5th Edition. It covers the foundational elements including the statement of scope, use case identification, object and operation definition, and the significance of data modeling and entity-relationship diagramming. The chapter emphasizes identifying data objects, their attributes, and the relationships between them, alongside techniques for creating flow models. An essential guide for understanding the structure and functionality of software systems.

Analysis Modeling
E N D
Presentation Transcript
Analysis Modeling Departemen Ilmu Komputer IPB 2009 Pressman 5th Ed. 2001 - Chapter 12 Analysis Modelling
Analysis Modeling:Where to Begin? • A statement of scope can be acquired from: • the FAST (Facilitated Application Specification Technique) working document • A set of use-cases • the statement of scope must be “parsed” to extract data, function and behavioral domain information Pressman 5th Ed. 2001 - Chapter 12 Analysis Modelling
Statement of Scope • a relatively brief description of the system to be built • indicates data that are input and output and basic functionality • indicates conditional processing (at a high level) • implies certain constraints and limitations Pressman 5th Ed. 2001 - Chapter 12 Analysis Modelling
Identifying Objectsand Operations • define “objects” by underlining all nouns in the written statement of scope • producers/consumers of data • places where data are stored • “composite” data items • define “operations” by double underlining all active verbs • processes relevant to the application • data transformations • consider other “services” that will be required by the objects Pressman 5th Ed. 2001 - Chapter 12 Analysis Modelling
Data Modeling and Entity Relationship (E-R)Diagramming Pressman 5th Ed. 2001 - Chapter 12 Analysis Modelling
Why Data Modeling? • examines data objects independently of processing • focuses attention on the data domain • creates a model at the customer’s level of abstraction • indicates how data objects relate to one another Pressman 5th Ed. 2001 - Chapter 12 Analysis Modelling
What is a Data Object? Object —something that is described by a set of attributes (data items) and that will be manipulated within the software (system) each instance of an object (e.g., a book) can be identified uniquely (e.g., ISBN #) each plays a necessary role in the system i.e., the system could not function without access to instances of the object each is described by attributes that are themselves data items Pressman 5th Ed. 2001 - Chapter 12 Analysis Modelling
Typical Objects external entities (printer, user, sensor) things (e.g, reports, displays, signals) occurrences or events (e.g., interrupt, alarm) roles (e.g., manager, engineer, salesperson) (e.g., division, team) organizational units places (e.g., manufacturing floor) structures (e.g., employee record) Pressman 5th Ed. 2001 - Chapter 12 Analysis Modelling
Data Objects and Attributes A data object contains a set of attributes that act as an aspect, quality, character-istic, or descriptor of the object object: automobile attributes: make model body type price options code Pressman 5th Ed. 2001 - Chapter 12 Analysis Modelling
What is a Relationship? • several instances of a relationship can exist • objects can be related in many different ways relationship —indicates “connectedness”; a "fact" that must be "remembered" by the system and cannot or is not computed or derived mechanically Pressman 5th Ed. 2001 - Chapter 12 Analysis Modelling
ERD Notation One common form: (0, m) object object relationship 1 2 (1, 1) attribute Another common form: relationship object object 1 2 (1, 1) (0, m) Pressman 5th Ed. 2001 - Chapter 12 Analysis Modelling
Building an ERD • Level 1—model all data objects (entities) and their “connections” to one another • Level 2—model all entities and relationships • Level 3—model all entities, relationships, and the attributes that provide further depth Pressman 5th Ed. 2001 - Chapter 12 Analysis Modelling
The ERD: An Example request for service Customer places (1,1) (1,m) (1,1) standard task table (1,n) work order generates (1,1) (1,1) (1,1) (1,w) work tasks selected from consists of (1,w) (1,i) materials lists Pressman 5th Ed. 2001 - Chapter 12 Analysis Modelling
Creating a Flow Model Pressman 5th Ed. 2001 - Chapter 12 Analysis Modelling
The Flow Model Every computer-based system is an information transform .... computer based system input output Pressman 5th Ed. 2001 - Chapter 12 Analysis Modelling
Flow Modeling Notation external entity process data flow data store Pressman 5th Ed. 2001 - Chapter 12 Analysis Modelling
External Entity A producer or consumer of data Examples: a person, a device, a sensor Another example: computer-based system Data must always originate somewhere and must always be sent to something Pressman 5th Ed. 2001 - Chapter 12 Analysis Modelling
Process A data transformer (changes input to output) Examples: compute taxes, determine area, format report, display graph Data must always be processed in some way to achieve system function Pressman 5th Ed. 2001 - Chapter 12 Analysis Modelling
Data Flow Data flows through a system, begins as input and is transformed into output. base compute triangle area area height Pressman 5th Ed. 2001 - Chapter 12 Analysis Modelling
Data Stores Data is often stored for later use. sensor # sensor #, type, location, age look-up sensor data report required type, location, age sensor number sensor data Pressman 5th Ed. 2001 - Chapter 12 Analysis Modelling
Data Flow Diagramming:Guidelines • all icons must be labeled with meaningful names • the DFD evolves through a number of levels of detail • always begin with a context level diagram (also called level 0) • always show external entities at level 0 • always label data flow arrows • do not represent procedural logic Pressman 5th Ed. 2001 - Chapter 12 Analysis Modelling
Constructing a DFD—I • review ERD to isolate data objects and grammatical parse to determine “operations” • determine external entities (producers and consumers of data) • create a level 0 DFD Pressman 5th Ed. 2001 - Chapter 12 Analysis Modelling
Level 0 DFD Example processing request user requested video signal digital video processor monitor video source NTSC video signal Pressman 5th Ed. 2001 - Chapter 12 Analysis Modelling
Constructing a DFD—II • write a narrative describing the transform • parse to determine next level transforms • “balance” the flow to maintain data flow continuity • develop a level 1 DFD • use a 1:5 (approx.) expansion ratio Pressman 5th Ed. 2001 - Chapter 12 Analysis Modelling
The Data Flow Hierarchy a b P x y level 0 level 1 c p2 a f p1 b p4 d 5 g p3 e Pressman 5th Ed. 2001 - Chapter 12 Analysis Modelling
Flow Modeling Notes • each bubble is refined until it does just one thing • the expansion ratio decreases as the number of levels increase • most systems require between 3 and 7 levels for an adequate flow model • a single data flow item (arrow) may be expanded as levels increase (data dictionary provides information) Pressman 5th Ed. 2001 - Chapter 12 Analysis Modelling
DFDs: A Look Ahead analysis model Maps into design model Pressman 5th Ed. 2001 - Chapter 12 Analysis Modelling
Behavioral Modeling and Process Specification Pressman 5th Ed. 2001 - Chapter 12 Analysis Modelling
Behavioral Modeling events behavior Outside world Application Pressman 5th Ed. 2001 - Chapter 12 Analysis Modelling
The States of a System • state—a set of observable circum-stances that characterizes the behavior of a system at a given time • state transition—the movement from one state to another • event—an occurrence that causes the system to exhibit some predictable form of behavior • action—process that occurs as a consequence of making a transition Pressman 5th Ed. 2001 - Chapter 12 Analysis Modelling
Behavioral Modeling • make a list of the different states of a system (How does the system behave?) • indicate how the system makes a transition from one state to another (How does the system change state?) • indicate event • indicate action • draw a state transition diagram Pressman 5th Ed. 2001 - Chapter 12 Analysis Modelling
State Transition DiagramNotation state event causing transition action that occurs new state Pressman 5th Ed. 2001 - Chapter 12 Analysis Modelling
State Transition Diagram full and start reading invoke manage-copying operator commands full invoke read-op-input copies done invoke read-op-input making copies reloading paper empty invoke reload paper jammed invoke problem-diagnosis not jammed invoke read-op-input problem state Pressman 5th Ed. 2001 - Chapter 12 Analysis Modelling
The Control Model the control flow diagram is "superimposed" on the DFD and shows events that control the processes noted in the DFD control flows—events and control items—are noted by dashed arrows a vertical bar implies an input to or output from a control spec (CSPEC) — a separate specification that describes how control is handled a dashed arrow entering a vertical bar is an input to the CSPEC a dashed arrow leaving a process implies a data condition a dashed arrow entering a process implies a control input read directly by the process control flows do not physically activate/deactivate the processes—this is done via the CSPEC Pressman 5th Ed. 2001 - Chapter 12 Analysis Modelling
Control Flow Diagram Pressman 5th Ed. 2001 - Chapter 12 Analysis Modelling
Control Specification (CSPEC) The CSPEC can be: state transition diagram (sequential spec) state transition table combinatorial spec decision tables activation tables Pressman 5th Ed. 2001 - Chapter 12 Analysis Modelling
Process Specification (PSPEC) bubble PSPEC narrative pseudocode (PDL) equations tables diagrams and/or charts Pressman 5th Ed. 2001 - Chapter 12 Analysis Modelling
A Design Note PSPEC one or more ”components" in the software design Pressman 5th Ed. 2001 - Chapter 12 Analysis Modelling
Creating Mini-Specs Software Specification Pressman 5th Ed. 2001 - Chapter 12 Analysis Modelling
The Data Dictionary Pressman 5th Ed. 2001 - Chapter 12 Analysis Modelling
Building a Data Dictionary Name: the primary name of the composite data item Aliases: other names for the data item Where used: data transforms (processes) that use the composite data item How used: the role of the data item (input, output, temporary storage, etc.) Description: a notation for representing content (presented on next slide) Format: specific information about data types, pre-set values (if known) Pressman 5th Ed. 2001 - Chapter 12 Analysis Modelling
Data Dictionary Notation Pressman 5th Ed. 2001 - Chapter 12 Analysis Modelling
Data Dictionary Example Pressman 5th Ed. 2001 - Chapter 12 Analysis Modelling
Writing the Software Specification Everyone knew exactly what had to be done until someone wrote it down! Pressman 5th Ed. 2001 - Chapter 12 Analysis Modelling