Yesterday
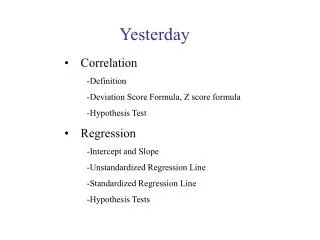
Yesterday. Correlation -Definition -Deviation Score Formula, Z score formula -Hypothesis Test Regression Intercept and Slope Unstandardized Regression Line Standardized Regression Line Hypothesis Tests. Summary. Correlation: Pearson’s r. Unstandardized Regression Line.

Yesterday
E N D
Presentation Transcript
Yesterday • Correlation • -Definition • -Deviation Score Formula, Z score formula • -Hypothesis Test • Regression • Intercept and Slope • Unstandardized Regression Line • Standardized Regression Line • Hypothesis Tests
Summary Correlation: Pearson’s r Unstandardized Regression Line Standardized Regression Line
Some issues with r • Outliers have strong effects • Restriction of range can suppress or augment r • Correlation is not causation • No linear correlation does not mean no association
Outliers Child 19 is lowering r Child 18 is increasing r
The restricted range problem • The relationship you see between X and Y may depend on the range of X • For example, the size of a child’s vocabulary has a strong positive association with the child’s age But if all of the children in your data set are in the same grade in school, you may not see much association
Common causes, confounds • Two variables might be associated because they share a common cause. • There is a positive correlation between ice cream sales and drownings. • Also, in many cases, there is the question of reverse causality
Non-linearity Some variables are not linearly related, though a relationship obviously exists For monotonic relationships that are not linear we use Spearman’s r
Regression: Analyzing the “Fit” How well does the regression line describe the data? Assessing “fit” relies on analysis of residuals Are the residuals randomly distributed? (If no, perhaps a linear model is inappropriate) How large are the residuals? Too big? (low correlation means big residuals)
Assumptions of Regression The residuals have mean of 0 and variance of sresid2 The residuals are uncorrelated with X The residuals are homoscedastic (similarly sized across the range of x)
Residual Diagnostics I: Graphing r = .96 r2 = .92
Residual Plot Residual Diagnostics I: Graphing resid Problem: curvilinearity
Residual Diagnostics I: Graphing Agreeableness Time 2
Residual Diagnostics I: Graphing Residual Plot Residuals Problem: heteroscedasticity
Residual plots ANOVA Regression: Analyzing the “Fit” How well does the regression line describe the data? Assessing “fit” relies on analysis of residuals Are the residuals randomly distributed? (If no, perhaps a linear model is inappropriate) How large are the residuals? Too big? (low correlation means big residuals)
Regression ANOVA SSY SSmodel SSresid Y Y’
Regression ANOVA F=t2 “the amount of variance in Y explained by our model”
Exercise Fill in the ANOVA table
Exercise 3 9