Download
1 / 26
260 likes | 407 Vues
2010 Citizen Satisfaction Survey Results. November 2010. Purpose. Determine how satisfied citizens are with quality of life, government and safety 2. Identify strengths and opportunities 3. Develop action plans for improvement.

E N D
2010 Citizen Satisfaction SurveyResults November 2010
Purpose Determine how satisfied citizens are with quality of life, government and safety 2. Identify strengths and opportunities 3. Develop action plans for improvement
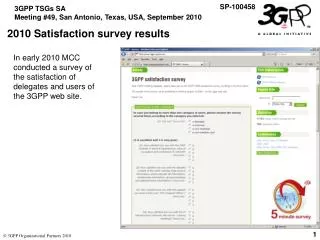
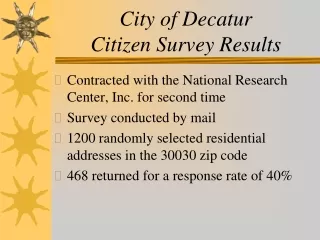
1.Survey was conducted by the Center for Survey Research, at the University of Virginia from (August-September 2010) A telephonic survey with pre-notification letters sent to all listed phone numbers. Telephone numbers included both cell-phone and landline 4. 25% response rate; 550 responses from randomly selected residents with a sampling error of + 4.2 percent Methodology Data not available by district
All Time High Ratings The Chesterfield County 2010 Citizen Satisfaction Survey ratings are in general higher than those in 2004 and 2006 and are comparable to or higher than those in 2008.
Highlighted Areas Quality of Life County Government Public Safety Normative Data Significant Variations in 2010 Post Survey Actions
I. Quality of Life • Quality of life • Education provided by schools • A place to raise children • Services for children and youth • County appearance • Environment
Quality of Life Overall, how would you rate the “Quality of Life” in Chesterfield County? Poor Fair Good Excellent “Above” the national norm “Above” local government norm
Quality of Life How would you rate schools in preparing students for success beyond high school: Poor Fair Good Excellent
Quality of Life How would you rate schools providing opportunities for citizens to contribute to the success of the public schools? Poor Fair Good Excellent
Quality of Life How would you rate Chesterfield as a place to raise children? Poor Fair Good Excellent “Above” the national norm“Above” local government norm
Quality of Life How would you rate services for children and youth, not including public education? Poor Fair Good Excellent *Question was not asked in 2006 “Above” the national norm“Above” local government norm
Quality of Life How would you rate the overall cleanliness and appearance of the county? Poor Fair Good Excellent “Above” the national norm “Above” local government norm
Quality of Life How would you rate the preservation and protection of the environment? Poor Fair Good Excellent “Below” the national norm “Below” local government norm
II. County Government • Employee ratings for: • Knowledge • Overall customer service • Management of the county • Getting citizens' views & opinions
County Government How would you rate Chesterfield County Employees on knowledge about county services? Poor Fair Good Excellent “Similar to” national norm “Similar to” local government norm
County Government How would you rate Chesterfield County Employees on overall customer service? Poor Fair Good Excellent “Similar to” national norm“Above” local government norm
County Government How would you rate the quality of management of the county? Poor Fair Good Excellent “Below” the national norm
County Government How would you rate Chesterfield County in getting citizens’ views and opinions before making major decisions that affect the county? Poor Fair Good Excellent “Similar to” national norm “Similar to” local government norm
III. Public Safety • 9-1-1 Emergency Communication Center • Personal safety… • …in neighborhoods • …in parks • …in shopping areas • …in schools • …in homes • …on roads as you travel • Overall safety index
Public Safety How would you rate 9-1-1 employees on: Poor Fair Good Excellent
Public Safety Index Please rate how you feel about your personal safety in the following areas: Favorable Rating 97.8% ***Your neighborhood during the day **Your neighborhood at night 94.2% 92.6% **Parks during the day **Parks at night 61.6% Shopping areas 96.1% Schools 96.8% 99.4% *Your home Roads as you travel 92.9% Overall safety index 91.4% Very Unsafe Very Safe *“Similar to” national norm **“Similar to” national & local norm ***“Below” national & local norm
IV.Normative Data Data provided by The National Research Center National Comparisons • 497 total jurisdictions* • Questions matched - 14 • 21 local jurisdictions across Virginia • Questions matched - 10 Local Government Comparisons *includes twelve in Canada
Normative Data National Comparisons • 4 questions were “Above” the norm • 5 questions were “Similar to” the norm • 5 questions were “Below” the norm
NORMATIVE DATA Normative Data Local Government Comparisons • 5 questions were “Above” the norm • 3 questions were “Similar to” the norm • 2 questions were “Below” the norm Local Governments Include: Arlington County, VA; Stafford County, VA; Botetourt County, VA; Chesapeake, VA; Hanover County, VA; Prince William County, VA; Virginia Beach, VA; Newport News, VA; Spotsylvania County, VA; Albemarle County, VA; Chesterfield County, VA; James City County, VA; Roanoke, VA; Williamsburg, VA; Hopewell, VA; Lynchburg, VA; Staunton, VA; Northampton County, VA; Lexington, VA
V. Significant Variationsin 2010 • 1. Preservation and protection of the environment 4.5% • 2. Safety in parks at night 9.5% • 3. Management of the county* 6.4% *2010 rating is better than 2004 and 2006
VI. Post Survey Actions Communication: • Present to CAPC • Provide results to Board of Supervisors • Present to Department Directors • Communicate to Employees • Post results to Internet/Intranet • Communicate to the Public Action items will involve reviewing these results and addressing them for ongoing improvement.