Download
1 / 9
90 likes | 239 Vues
One sample Tests & Intervals on the Calculator. The ages of a group of volunteers were: 27, 16, 9, 14, 32, 15, 16, 13. The manager wants to show that the average age is less than the national average of 18. Test at a 5% significance level. Give the hypotheses:.

E N D
The ages of a group of volunteers were: 27, 16, 9, 14, 32, 15, 16, 13. The manager wants to show that the average age is less than the national average of 18. Test at a 5% significance level. Give the hypotheses: What kind of Test? (Use formula) Put your data in L1 Output Go to Stat → Test Result: Input
A researcher claims that the average wind speed in a certain city is 8 mph. A sample of 32 days has an average wind speed of 8.2 mph and the standard deviation is 6mph. At 10% significance, is there enough evidence to reject the claim. Give the hypotheses: What kind of Test? (Use formula) Go to Stat → Test Output Result: Input
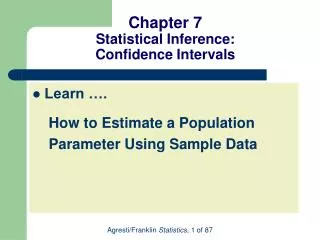
The average weight of 60 randomly selected compact automobiles was 2627 pounds. The standard deviation was $33. Find the 90% confidence interval of the population mean. What kind of Interval? (Use formula) Go to Stat → Test Output Input Result:
Educators estimate the dropout rate is 15%. Last year 38 seniors from a random sample of 200 seniors withdrew. At a 5% significance level, is there enough evidence to reject the claim? Hypotheses: What kind of Test? (Use formula) Go to Stat → Calc → Test Output Input Result:
In a study of 204 accidents that required treatment in an emergency room, 42% occurred at home. Find the 95% confidence interval of the true proportion of accidents that occur at home. What kind of Interval? (Use formula) Go to Stat → Calc → Test Output Input Result:
A telephone company representative estimates that 40% of its customers want call-waiting. To test this hypothesis, she selected a sample of 105 customers and found that 37% had call waiting. At a 1% significance, is her estimate appropriate? Hypotheses: What kind of Test? (Use formula) Go to Stat → Calc → Test Output Input Result:
Homework • Worksheet • Identify the hypothesis • Give the formula • Give the test statistic • Give the p-value • State the decision