Une image / un lien ci-dessous est fourni (tel quel) pour télécharger la présentation
Politique de téléchargement : le contenu du site vous est fourni TEL QUEL pour votre information et votre usage personnel ; il ne peut être vendu, concédé sous licence ni partagé sur d’autres sites sans l’accord de son auteur.Le contenu vous est fourni TEL QUEL, pour votre information et votre usage personnel uniquement.Téléchargez la présentation en cliquant sur ce lien.Lors du téléchargement, si vous ne parvenez pas à télécharger une présentation, l’éditeur a peut-être supprimé le fichier de son serveur.Pendant le téléchargement, si vous ne parvenez pas à obtenir une présentation, le fichier a peut-être été supprimé par l’éditeur.
F I N
Plus de contenu associé
Transcription de la présentation
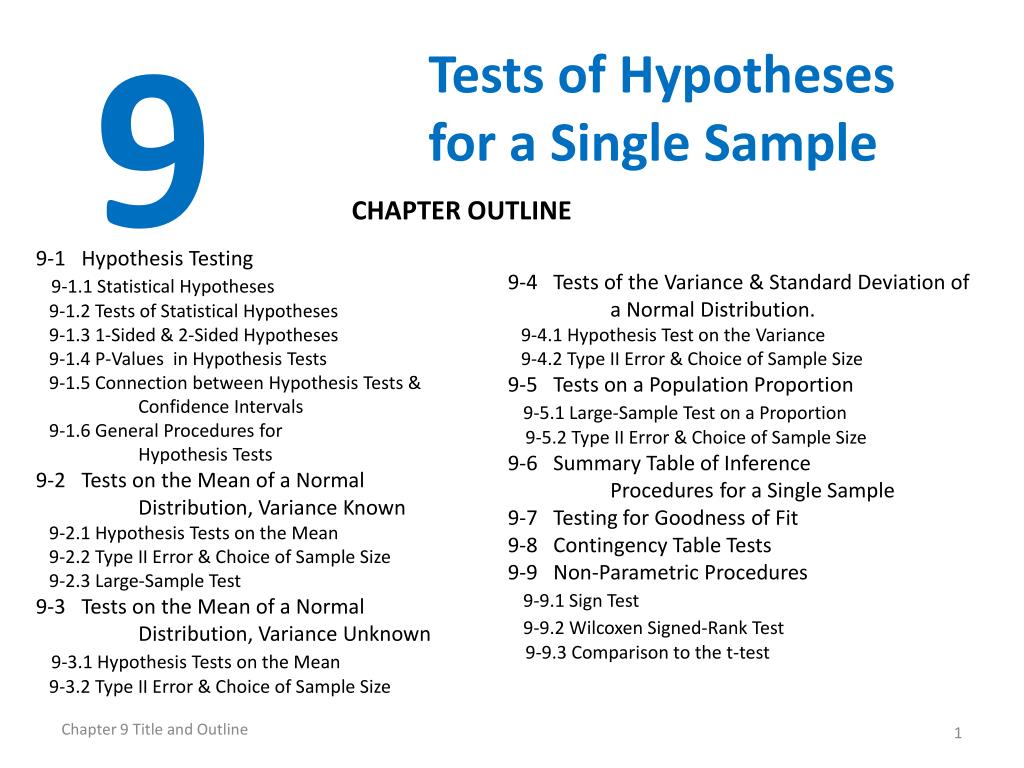
9 Tests of Hypotheses for a Single Sample CHAPTER OUTLINE 9-1 Hypothesis Testing 9-1.1 Statistical Hypotheses 9-1.2 Tests of Statistical Hypotheses 9-1.3 1-Sided & 2-Sided Hypotheses 9-1.4 P-Values in Hypothesis Tests 9-1.5 Connection between Hypothesis Tests & Confidence Intervals 9-1.6 General Procedures for Hypothesis Tests 9-2 Tests on the Mean of a Normal Distribution, Variance Known 9-2.1 Hypothesis Tests on the Mean 9-2.2 Type II Error & Choice of Sample Size 9-2.3 Large-Sample Test 9-3 Tests on the Mean of a Normal Distribution, Variance Unknown 9-3.1 Hypothesis Tests on the Mean 9-3.2 Type II Error & Choice of Sample Size 9-4 Tests of the Variance & Standard Deviation of a Normal Distribution. 9-4.1 Hypothesis Test on the Variance 9-4.2 Type II Error & Choice of Sample Size 9-5 Tests on a Population Proportion 9-5.1 Large-Sample Test on a Proportion 9-5.2 Type II Error & Choice of Sample Size 9-6 Summary Table of Inference Procedures for a Single Sample 9-7 Testing for Goodness of Fit 9-8 Contingency Table Tests 9-9 Non-Parametric Procedures 9-9.1 Sign Test 9-9.2 Wilcoxen Signed-Rank Test 9-9.3 Comparison to the t-test Chapter 9 Title and Outline
Learning Objectives for Chapter 9 After careful study of this chapter, you should be able to do the following: • Structure engineering decision-making as hypothesis tests. • Test hypotheses on the mean of a normal distribution using either a Z-test or a t-test procedure. • Test hypotheses on the variance or standard deviation of a normal distribution. • Test hypotheses on a population proportion. • Use the P-value approach for making decisions in hypothesis tests. • Compute power & Type II error probability. Make sample size selection decisions for tests on means, variances & proportions. • Explain & use the relationship between confidence intervals & hypothesis tests. • Use the chi-square goodness-of-fit test to check distributional assumptions. • Use contingency table tests. Chapter 9 Learning Objectives
9-1 Hypothesis Testing 9-1.1 Statistical Hypotheses Statistical hypothesis testing and confidence interval estimation of parameters are the fundamental methods used at the data analysis stage of a comparative experiment, in which the engineer is interested, for example, in comparing the mean of a population to a specified value. Definition
9-1 Hypothesis Testing 9-1.1 Statistical Hypotheses • For example, suppose that we are interested in the burning rate of a solid propellant used to power aircrew escape systems. • Now burning rate is a random variable that can be described by a probability distribution. • Suppose that our interest focuses on the mean burning rate (a parameter of this distribution). • Specifically, we are interested in deciding whether or not the mean burning rate is 50 centimeters per second.
9-1 Hypothesis Testing 9-1.1 Statistical Hypotheses Two-sided Alternative Hypothesis null hypothesis alternative hypothesis One-sided Alternative Hypotheses
9-1 Hypothesis Testing 9-1.1 Statistical Hypotheses • Test of a Hypothesis • A procedure leading to a decision about a particular hypothesis • Hypothesis-testing procedures rely on using the information in a random sample from the population of interest. • If this information is consistent with the hypothesis, then we will conclude that the hypothesis is true; if this information is inconsistent with the hypothesis, we will conclude that the hypothesis is false.
9-1 Hypothesis Testing 9-1.2 Tests of Statistical Hypotheses Figure 9-1Decision criteria for testing H0: = 50 centimeters per second versus H1: 50 centimeters per second.
9-1 Hypothesis Testing 9-1.2 Tests of Statistical Hypotheses Sometimes the type I error probability is called the significance level, or the -error, or the size of the test.
9-1 Hypothesis Testing Definition • The power is computed as 1 - b, and power can be interpreted as the probability of correctly rejecting a false null hypothesis. We often compare statistical tests by comparing their power properties. • For example, consider the propellant burning rate problem when • we are testing H0 : m = 50 centimeters per second against H1 : m not equal 50 centimeters per second . Suppose that the true value of the mean is m = 52. When n = 10, we found that b = 0.2643, so the power of this test is 1 - b = 1 - 0.2643 = 0.7357 when m = 52.
9-1 Hypothesis Testing The bottler wants to be sure that the bottles meet the specification on mean internal pressure or bursting strength, which for 10-ounce bottles is a minimum strength of 200 psi. The bottler has decided to formulate the decision procedure for a specific lot of bottles as a hypothesis testing problem. There are two possible formulations for this problem, either or
9-1 Hypothesis Testing 9-1.5 Connection between Hypothesis Tests and Confidence Intervals
9-1 Hypothesis Testing 9-1.6 General Procedure for Hypothesis Tests 1. From the problem context, identify the parameter of interest. 2. State the null hypothesis, H0. 3.Specify an appropriate alternative hypothesis, H1. 4.Choose a significance level, . 5.Determine an appropriate test statistic. 6.State the rejection region for the statistic. 7.Compute any necessary sample quantities, substitute these into the equation for the test statistic, and compute that value. 8.Decide whether or not H0 should be rejected and report that in the problem context.
9-2 Tests on the Mean of a Normal Distribution, Variance Known 9-2.1 Hypothesis Tests on the Mean Reject H0 if the observed value of the test statistic z0 is either: z0 > z/2 or z0 < -z/2 Fail to reject H0 if -z/2 < z0 < z/2
9-3 Tests on the Mean of a Normal Distribution, Variance Unknown 9-3.1 Hypothesis Tests on the Mean (Figures 9-10, 11, 12) Figure 9-10The reference distribution for H0: = 0 with critical region for (a) H1: 0 , (b) H1: > 0, and (c) H1: < 0.
Connexion au compte
Connectez-vous pour publier votre contenu sur SlideServe.