Download
1 / 38
400 likes | 664 Vues
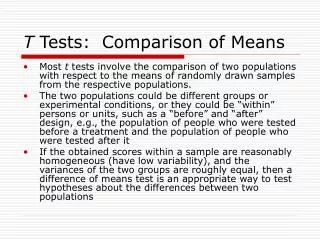
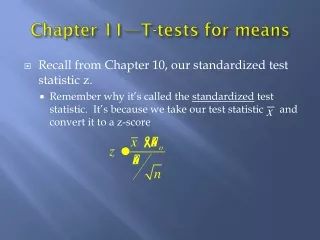
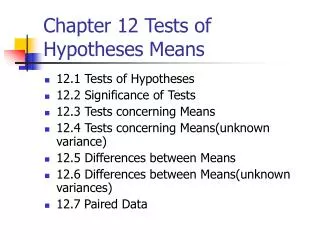
Chapter 12 Tests of Hypotheses Means. 12.1 Tests of Hypotheses 12.2 Significance of Tests 12.3 Tests concerning Means 12.4 Tests concerning Means(unknown variance) 12.5 Differences between Means 12.6 Differences between Means(unknown variances) 12.7 Paired Data. 12.1 Tests of Hypotheses.

E N D
Chapter 12 Tests of Hypotheses Means • 12.1 Tests of Hypotheses • 12.2 Significance of Tests • 12.3 Tests concerning Means • 12.4 Tests concerning Means(unknown variance) • 12.5 Differences between Means • 12.6 Differences between Means(unknown variances) • 12.7 Paired Data
12.1 Tests of Hypotheses • In a law case, there are 2 possibilities for the truth—innocent or guilty • Evidence is gathered to decide whether to convict the defendant. The defendant is considered innocent unless “proven” to be guilty “beyond a reasonable doubt.” Just because a defendant is not found to be guilty doesn’t prove the defendant is innocent. If there is not much evidence one way or the other the defendant is not found to be guilty.
For Statistical Hypothesis Testing • H0=Null hypothesis (innocent) Held on to unless there is sufficient evidence to the contrary • HA=Alternative hypothesis (guilty) We reject H0 in favor of HA if there is enough evidence favoring HA
12.1 Tests of Hypotheses • Distribution(s) or population(s): • Parameter(s) such as mean and variance • Assertion or conjecture about the population(s) – statistical hypotheses 1. About parameter(s): means or variances 2. About the type of populations: normal , binomial, or …
Example 12.1 • Is a coin balanced? This is the same as to ask if p=0.5 • Is the average lifetime of a light bulb equal to 1000 hours? The assertion is μ=1000
Null Hypotheses and Alternatives • We call the above two assertions Null Hypotheses Notation: H0: p=0.5 and H0:μ=1000 If we reject the above null hypotheses, the appropriate conclusions we arrive are called alternative hypotheses HA: p0.5 HA: μ1000
Null Hypothesis vs Alternative • H0: p=0.5 vs HA: p0.5 • H0:μ=1000 vs HA: μ1000 • It is possible for you to specify other alternatives • HA: p>0.5 or HA: p<0.5 • HA: μ>1000 or HA: μ<1000
12.2 Significance of Tests • A company claims its light bulbs last on average 1000 hours. We are going to test that claim. • We might take the null and alternative hypotheses to be H0:μ=1000 vs HA: μ1000 or may be H0:μ=1000 vs HA: μ<1000
Mistakes or errors: • Law case—convict an innocent defendant; or fail to convict a guilty defendant. • The law system is set up so that the chance of convicting an innocent person is small. Innocent until “proven guilty” beyond a reasonable doubt.
Two Types of Errors in statistical testing • Type I error -- reject H0 when it is true (convict innocent person) • Type II error -- accept H0 when it is not true (find guilty person innocent)
Statistical hypotheses are set up to • Control type I error =P(type I error) =P(reject H0 when H0 true) (a small number) • Minimize type II error =P(type II error) =P(accept H0 when H0 false)
Control Types of Errors • In practice, is set at some small values, usually 0.05 • If you want to control at some small values, you need to figure out how large a sample size (n) is required to have a small also. • 1- is called the power of the test • 1- =Power=P(reject H0 when H0 false)
Example 12.2 • X=breaking strength of a fish line, normal distributed withσ=0.10. • Claim: mean is =10 • H0: =10 vs HA: 10 A random sample of size n=10 is taken, and sample mean is calculated • Accept H0 if • Type I error? • Type II error when =10.10?
Solution • Type I error=P(reject H0 when =10)
Solution • Type II error=P(accept H0 when H0 false) • Power=1-0.0571=0.9429
12.3 & 12.4 Tests concerning Means • A company claims its light bulbs last an average 1,000 hours • 5 steps to set up a statistical hypothesis test
5 steps: step 1 1. Set up H0 and HA H0: =1,000 vs HA: <1,000 This is a one-sided alternative. Other possibilities include H0: =1,000 vs HA: 1,000 (Two sided alternative) Note: we could writeH0: ≥1,000, but in this book H0 is always written with an equal (=) sign.
5 steps: step 2 and 3 2. Specify =P(type I error): level of significance. =0.05 usually. This corresponds to 95% confidence. 3. Decide on sample size, n, and specify when to reject H0 based on some statistic so that =P(Reject H0 when H0 is true)
Step 3 continued • Suppose we use n=10 bulbs. Find the sample mean , and compare to 1000. We need to set a probability to a=0.05, so we want a statistic we can compare to a table of probabilities. • If we know , then set z has a standard normal distribution if =1,000 and then we can use the normal table.
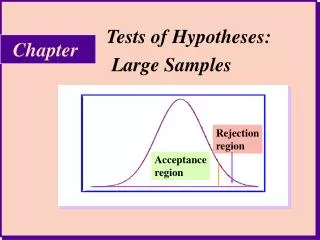
Step 3 continued • Reject H0: =1,000 in favor of HA: <1,000 if the sample mean is too far below 1000. This will give us a negative value of z. How far below 0 does z have to be for us to reject H0? • The rejection region is set up so that the probability of rejecting H0 is only a=5% if H0 is true. • So we reject H0 if
Step 3 continued: if s is unknown • If is unknown, the usual situation, and the population is normal, we use a t distribution. Calculate sample deviation s: • Rejection region:
5 steps: step 4 4. Collect the data and compute the statistics: z or t Suppose , s=30, n=10 then
5 steps: step 5 5. Decide whether to reject H0 t=-3.16<-1.833 is in the rejection region Reject H0: =1,000 in favor of HA: <1,000 at a=0.05 level.
5 steps summary • 1. hypothesis statement • 2. Specify level of significance a • 3. determine the rejection region • 4. compute the test statistic from data • 5. conclusion
Relationship Between Hypotheses Testing and Confidence Intervals • For two tailed test: To accept null hypothesis at level H0: =0 is equivalent to showing 0 is in the (1-) Confidence Interval for .
Example 12.3 • Normal population. unknown • H0: =750 vs HA: 750 • Define • Reject H0 if the sample mean is too far from 750 in either direction • Rejection region:
Example • Let’s take =0.05, n=20 (df=19) • Data turned out to be • Get t: • t0.025=2.093 • |t|<2.093 • Conclusion: accept H0
Example 12.3 (continued) • =50 is known, =0.05, n=20 • H0: =750 vs HA: 750 • Reject region |z|>z0.025=1.96 • Calculate z • |z|<1.96. Accept H0 • Question: if =0.10, what is the conclusion?
More cases • H0: =1000 vs HA: >1000 • Define t or z statistics ( unknown or known) • Rejection regions: t>t or z>z
P-value • In practice more commonly one performs the test by computing a p-value. • The book describes revised steps 3, 4, 5 as 3.’ We specify the test statistic. 4.’ Using the data we compute the test statistic and find its p-value. 5.’ If p-value<a, reject H0.
P-value • The book’s definition of p-value: A p-value is the lowest level of a at which we could reject H0. • A more usual way to think about p-values: If H0 is true, what is the probability of observing data with this much or more evidence against H0.
Example • H0: m=120 vs HA: m<120 a=0.05 • From the data z=-1.78 • Evidence against H0 is sample mean less than 120, meaning z<0. • P-value<0.05Reject H0: m=120 in favor of HA: m<120 • The reject/accept H0 decision is the same as comparing z to -1.645, but the p-value gives more information—How inconsistent are the data with H0?
If z is less than -1.645, then the p-value is less than 0.05. Comparing the p-value to 0.05 is the same as comparing the z value to -1.645. • For t tests we can find the exact p-value without a calculator or software.
P-value for 2-sided test • H0: m=120 vs HA: m≠120 a=0.1 • From the data z=1.32 • Evidence against H0 is z values away from 0 in either direction • P-value=2*0.0934=0.1868 • P-value>a, Do not reject H0. • 2-sided p-value=2*(1-sided p-value)
Exercise • Given that n=25, s=100, and sample mean is 1050, • 1. Test the hypotheses H0: m=1000 vs HA: m<1000 at level a=0.05. • 2. Test the hypotheses H0: m=1000 vs HA: m≠1000 at level a=0.05.
Solution • 1. • 2. More evidence against H0 is smaller values of z Evidence against H0 is z values away from 0 in either direction
A word of caution • NOTE: Accepting H0 does not prove H0 is true. There are many other possible values in the confidence interval. • OPINION: In most situations it would be more useful to report confidence intervals rather than results of hypothesis tests.