Assessing Hypotheses: Means & Graphs
Assessing Hypotheses: Means & Graphs. Lecture plan. Hypotheses Cross-tabs, means, or graphs? Comparing means Creating and interpreting graphs. Hypotheses. What are hypotheses? Testable statements about empirical relationships Derived from theory. Examples:

Assessing Hypotheses: Means & Graphs
E N D
Presentation Transcript
Lecture plan • Hypotheses • Cross-tabs, means, or graphs? • Comparing means • Creating and interpreting graphs
Hypotheses • What are hypotheses? • Testable statements about empirical relationships • Derived from theory. • Examples: • The more religious are more Republican. • Democratic states do not go to war with one another. • Droughts depress the vote of the Democratic party. • How do we test hypotheses? • It depends on the data.
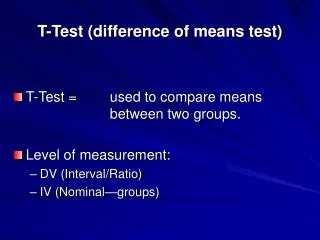
Continuous DV • Crosstabs works for nominal and ordinal dependent and independent variables • But what do we do when the dependent variable is interval and the independent variable is nominal? • Compare means; Bar chart (more on this later). • What do you do when the dv is interval and the iv is ordinal? • Line graph (more on this later). • When both are interval?
Continuous v. Nominal • Let’s start with a question that has puzzled social scientists for centuries: “Do Canadians have more fun than Brits and Americans?” So we hypothesize: “Canadians will report higher levels of fun than Brits and Americans.” Validity problems?
Do Canadians Have More Fun? • Fortunately, you have a “thermometer” measuring the self-reported fun experienced by Canadians, Brits, and Americans (technically called the Fun-O-Meter). • What is your (continuous) DV? • What is your (nominal) IV? • How would you test the hypothesis that Canadians have more fun than Brits or Americans?
Comparing Means • Right-O! • Compare the mean of the dependent variable across values of the independent variable. • This is how you do it…
Comparing Means • Who has more fun?
Graphical Comp of Means: Bar Chart TV hours per week • Continuous v. categorical (nom, ord) • This is not a frequency bar chart!
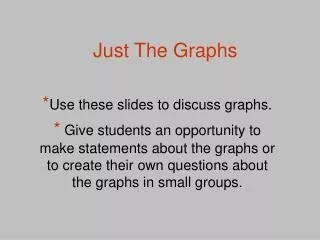
Graphs Bar Simple Summaries Define How’d that happen?
Bye Bye Nominal; Hello Line Graphs • Works for all levels of measurement except nominal data • Continuous v. nominal (ordinal): Complements means comparison. • Ordinal v. Ordinal (numerically coded) • Continuous v. Continuous • Let’s look at ourselves again: • Two ordinal variables: • 7-category Dem Party L-R Placement Variable • 5-category Religious Attendance Variable • Do more religiously observant students view the Dem Party differently than less observant students?
Line Graph: Dem L-R v. Religious “Negative Relationship”
Line Graph: Rep L-R v. Religious “positive” or “curvilinear”
Graphs lines… Simple Summaries for groups of cases Define Next: Other summary function Enter variables OK How’d that happen?
Continuous v. Continuous? • Hmm… what if BOTH the dependent and independent variables are continuous? • DV: Hours spent exercising and playing sports. • IV: Hours spent watching TV. • What would happen if we just line graphed “TV” against “exercise”???
This rolling average takes the mean of the original observation and those two hours before and after.