Download
1 / 13
150 likes | 434 Vues
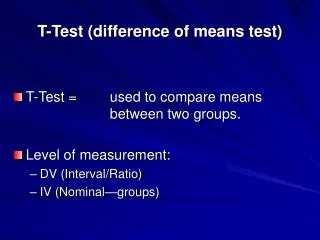
T-Test (difference of means test). T-Test = used to compare means between two groups. Level of measurement: DV (Interval/Ratio) IV (Nominal—groups). Hypotheses. Example: Gender and Income Hr1: The mean income for women differs from the mean income for men.

E N D
T-Test (difference of means test) • T-Test = used to compare means between two groups. • Level of measurement: • DV (Interval/Ratio) • IV (Nominal—groups)
Hypotheses • Example: Gender and Income • Hr1: The mean income for women differs from the mean income for men. • Hr2: Women make less on average than men. • or Hr3: Men make more on average than women.
One Tailed vs. Two Tailed Test • See overhead
Can you come up with a relationship that would require using a t-test? • How would you state the hypothesis?
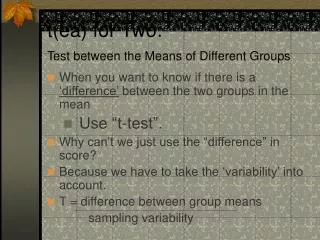
What does the t-test do? • t-Test tells us if the difference in means is due sampling error or if the sample supports our hypothesis that the difference reflects a true difference in the population.
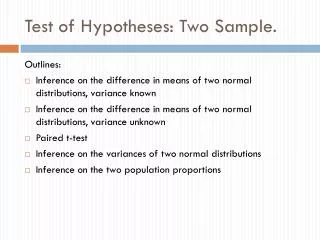
Independent vs. Dependent Samples Independent = groups are not linked Ex (gender): the selection of each male in the sample is independent of the selection of each female in the sample. Dependent = groups are linked in some way: Ex (couples): husbands and wives selected for a study on marital happiness. Each male in the sample is linked to a female in the sample. Ex: Two groups compared on a before and after test.
Independent Samples t-test • GSS data = each individual in the sample is chosen independently of all other individuals in the sample, • So, • use independent sample t-test • Even though the GSS is one sample, we can conduct t-test on groups (e.g. men/women) in GSS.
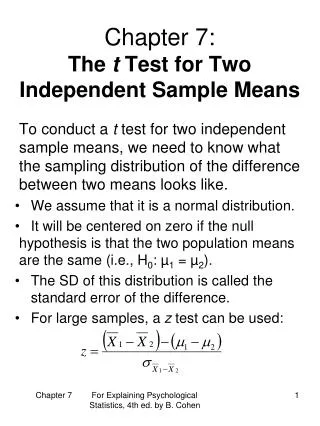
Formula: t = see board/overhead The formula is a ratio of the difference in means to the standard error of means (sampling error). • Standard error = the standard deviation of the difference between means. • (Is the difference due to sampling error or does the difference reflect a true population difference?)
Three Points About Difference of Means • 1. The larger the sample the less likely the difference between means is due to sampling error. • 2. The larger the difference between means the less likely the difference is due to sampling errors. • 3. The smaller the variance around the mean for each group, the less likely the difference is due to sampling error.
Equal and Unequal Variance SPSS conducts a F test for equal variance. Hr: Variance of sample1 is not equal to variance of sample 2. Ho: Variance of sample 1 is equal to variance of sample 2. F test, test for equal variance Fail to reject Ho = Use t-test for equal variance. Importance: A slight change in the calculation of the standard error.
Equal Variance = Pooled variance used in the calculation of the standard error. • Unequal Variance = Calculation does not use pooled variance.