Download
1 / 41
410 likes | 542 Vues
This guide covers various aspects of hypothesis testing involving two samples, crucial for engineers and scientists. It outlines the inference techniques for differences in means of normal distributions, both with known and unknown variance, paired t-tests, and comparisons of variances and population proportions. Through practical examples, such as testing paint drying times and catalyst yields in chemical processes, it illustrates the application of statistical methods, hypothesis formulation, test statistics, and conclusions based on significance levels. Key concepts are explained to enable effective decision-making in research.

E N D
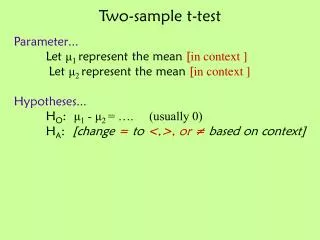
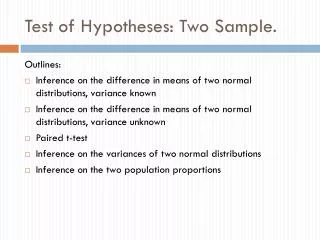
Test of Hypotheses: Two Sample. Outlines: • Inference on the difference in means of two normal distributions, variance known • Inference on the difference in means of two normal distributions, variance unknown • Paired t-test • Inference on the variances of two normal distributions • Inference on the two population proportions
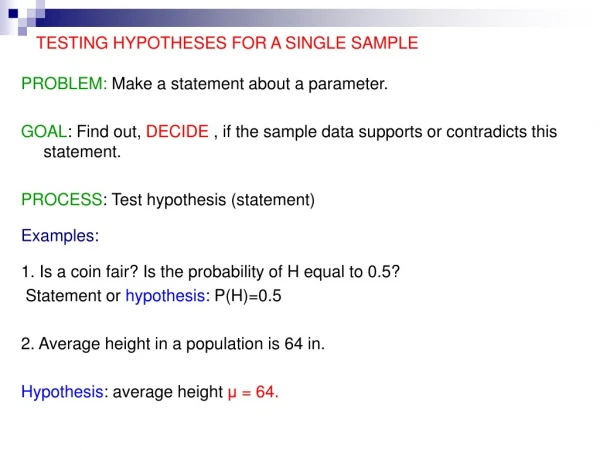
Hypothesis testing • Engineers and scientist are often interested in comparing two difference conditions to determine whether either conditions produce a significant effect on the response. • Condition => Treatment • Cause and effect relationship: the difference in treatments resulted in the difference in response.
Case I • Inference on the difference in means of two normal distributions, variance known • Hypothesis • Test Statistic • We should reject H0 if
Case I • Ex. A product developer is interested in reducing the drying time of a primer paint. Two formulations (old, new) of the paint are tested. The sd of drying time is 8 mins. Ten specimens are paint with formulation 1, and another 10 specimens are painted with formulation 2; the 20 specimens are paint in random order. The two sample average drying times are • What conclusion can be drawn about the effectiveness of the new ingredient, using =0.05 • Parameter of interest is the difference in mean drying time, • =0.05 • Test statistic , • reject H0 if • Calculate Z0 = 2.52 • Conclusion : since , we reject H0 at 0.05 significance level. Adding new ingredient to the paint significantly reduces the drying time.
Case I • Sample size • Using Operating Characteristic Curve (OC Curve) If the value of , we can use the formula to calculate the value of n1 when n2 is fixed, n=n1=n2
Case I • Sample Size formulas
Case I • Confidence Interval The error in estimating µ1-µ2 by will be less than E at 100(1- )% confidence. The required sample size from each population is
Case I • Ex. Tensile strength tests were performed on two different grades of aluminum spars. From past experience with the spar manufacturing process and testing procedure, the standard deviations of the tensile strengths are assumed to be known. The data obtained are as follows: • Find a 90% confidence interval on the difference in mean strength µ1-µ2
Case I.I • We can use the concept of Case I for the cases that we don’t know exactly about the population distribution (may be not normal distribution) and the number of sample size are large. (n1, n2 >=40)
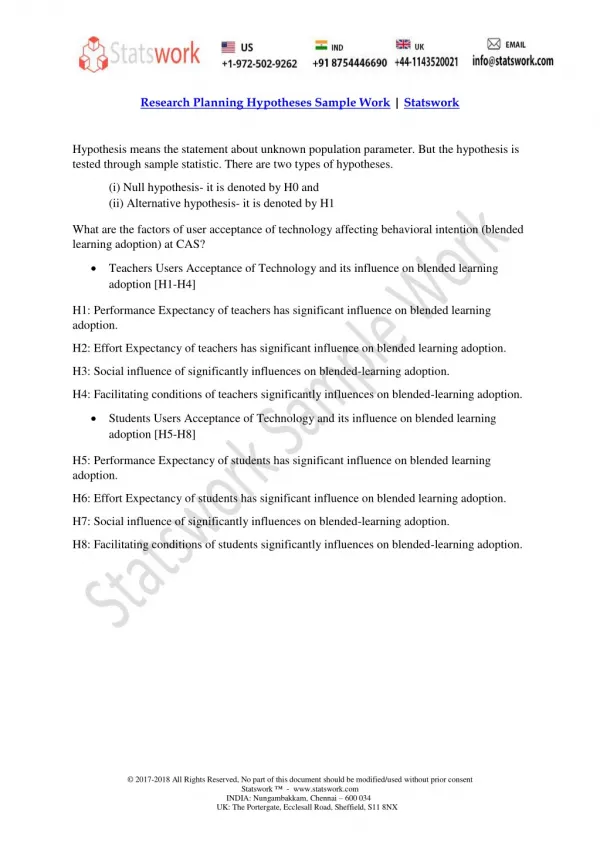
Case II.I • Inference on the difference in means of two normal distributions, variance unknown • Case 1: • Hypothesis • Test Statistic • We should reject H0 if Pooled Estimator of variance
Case II.I • Ex. Two catalysts are being analyzed to determine how they affect the mean yield of a chemical process. Specifically, catalyst 1 is currently in use, but catalyst 2 is acceptable. Since catalyst 2 is cheaper, it should be adopted, providing it does not change the process yield. A test is run in the pilot plant and results in the data shown in Table. Is there any difference between the mean yields? Use =0.05, and assume equal variances.
Case II.I • Parameter of interest: µ1 and µ2, the mean process yield using C1, and C2 • H0: µ1-µ2=0 or H0: µ1=µ2 , H1: µ1≠µ2 • =0.05 • Test statistic is • Reject H0 if • Calculate t0; • Conclusion H0 cannot be rejected. At the 0.05 level of significant, we do not have a strong evidence to conclude that C2 results in a mean yield differ from C1
Case II.II • Inference on the difference in means of two normal distributions, variance unknown • Case 2: • Hypothesis • Test Statistic • We should reject H0 if Degree of freedom
Case II.II • Ex. Arsenic concentration in public drinking water supplies is a potential health risk. An article in the Arizona Republic reported drinking water arsenic concentration in parts per billion (ppb) for 10 metropolitan Phoenix communities and 10 communities in rural Arizona.
Case II.II • Parameter of interest: µ1 and µ2, the mean arsenic concentration of two regions • H0: µ1-µ2=0 or H0: µ1=µ2 , H1: µ1≠µ2 • =0.05 • Test statistic: • We should reject H0 if • Compute t0
Case II.II 7. Conclusion: t0<t0.025,13, we reject H0. There is evidence to conclude that the mean arsenic concentration in the drinking water in rural Arizona is differ from the mean arsenic concentration in metropolitan Phoenix. Furthermore, the mean arsenic is higher in rural of Arizona. P value is approximate P=0.016
Case II • Sample size can be approximated by OC curves • Only for the case that 1= 2 • Where and • Ex.
Case III: Paired t- test • A special case of the two-sample t-test. This test is used when the observations on the two populations of interest are collected in pairs. • Each pair of observations is taken under homogeneous condition. • Ex. We are interested in comparing two different types of tips for a hardness-testing machine. Tip1 Tip2 Tip1 Tip2 Pair t-test Comparing the depth of the depression caused by the tips Sheet Metal 2 sample test
Case III: Paired t-test • Paired t-test • Hypothesis • Test Statistic • We should reject H0 if
Case III: Paired t-test • Ex. An article in the journal of Strain Analysis compares several methods for predicting the shear strength for steel plate girders. Data for two of these methods, Karlsruhe and Lehigh procedures, when applied to nine specific girders are shown in table. We wish to determine whether there is any difference between the two methods.
Case III: Paired t-test • Parameter of interest: the difference in mean shear strength between the two methods µD=µ1-µ2 • H0: µD=0, H1: µD≠0 • =0.05 • Test statistic: • We should reject H0 if • Calculate t0 • T0 =6.08>2.306, we conclude that the strength prediction methods yield different results. Specifically, the data indicate that the Karlsruhe method procedures, on the average, higher strength predictions than does the Lehigh method. P value for t0 = 6.08 is P=0.0003
Case III: Paired t-test • Confidence Interval
Inference on the variance two normal distribution • Hypothesis • Test Statistic • We should reject H0 if
Inference on the variance two normal distribution • Sample size: can be approximated by OC curve • Only for the case that n1=n2=n • Where • Ex
Inference on the variance two normal distribution • Confidence Interval on the ratio of two variances
Test on two population proportion • Hypothesis • Test Statistic • We should reject H0 if
Test on two population proportion • Type II error
Test on two population proportion • Sample size • For one sided, replace /2 by
Test on two population proportion • Confidence Interval on the difference in Population proportions
Homework • Using Minitab program to find the conclusion of these problems. • An article in solid state technology describes an experiment to determine the effect of the C2F6 flow rate on the uniformly of the etch on a silicon wafer used in integrated circuit manufacturing. Data for two flow rate are as follows: • Does the C2F6 flow rate affect average etch uniformity? Use =0.05 • What is the P-value for the test in a) • Does the C2F6 flow rate affect the variability in etch uniformity? Use =0.05 • Draws box plots to assist in the interpretation of the data from this etch uniformity.
Homework 2. A computer scientist is investigating the usefulness of two different design languages in improving programming task. Twelve expert programmers, familiar with both languages, are asked to code a standard function in both language, and the time (in minutes) is recorded. The data follow: • Is the assumption that the difference in coding time is normally distributed reasonable? • Find P-value for the test in a) • Find a 95% confidence interval on the difference in mean coding times. Is there any indication that one design language is preferable?