t-Test: Statistical Analysis
t-Test: Statistical Analysis. What is a t-Test?. Statistical test used in hypothesis testing Example: Comparing Group A to Group B Used to determine if the difference between 2 mean values is significantly different or just difference due to random chance

t-Test: Statistical Analysis
E N D
Presentation Transcript
What is a t-Test? • Statistical test used in hypothesis testing • Example: Comparing Group A to Group B • Used to determine if the difference between 2 mean values is significantly different or just difference due to random chance • Example: Compare the mean between Per. 2 and Per. 3 scores on the Unit 3 exam
when looking at the differences between scores for two groups, we have to judge the difference between their means relative to the spread or variability of their scores. • The t-test does just this! Difference between mean is the same; variability of scores is different!
t-Test Formula (leads to tcalc) • The formula for the t-test is a ratio. • The top part of the ratio is just the difference between the two means or averages. • The bottom part is a measure of the variability or dispersion of the scores (takes into account standard deviation).
standard deviation: shows how much variation or “dispersion" exists from the average (mean, or expected value). • A low standard deviation indicates that the data points tend to be very close to the mean, • A high standard deviation indicates that the data points are spread out over a large range of values.
How to Interpret Your t-Test Results • You will need: degrees of freedom (df) • the degrees of freedom is the sum of the data points in both groups minus 2 • Ex: add up the number of tests taken for both Per 2 & 3 and then subtract 2 • You will need: computed “t” value (tcalc) • This will always be given to you. IB doesn’t require you to actually do the math. • You will need: a “table of significance” • Use the degrees of freedom & the “t” value to look up the probability of these two groups being the same
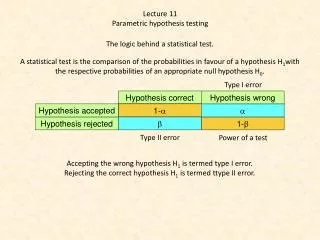
What is considered “significantly” different? • The results are considered “significantly” different if the researcher is 95% confident that the difference observed is a real difference. • This means there is only a 5% chance (or probability) that the difference observed is due to random chance. p= 0.05 • p-value = 0.6; probability of 60% that two sets of values came from the same group and any observed differences are due to random chance • p-value = 0.1; probability of 10% that two sets of values came from the same group and any observed differences are due to random chance • p-value = 0.05; only 5% probability that the two sets of values came from the same group. Therefore, the difference is significant!! • If the p-value is less than 0.05 (ex: p= 0.04), the results are significant and the researcher is 96% confident that the differences observed between the two groups is not due to random chance.
Ex #1: Two different classes take the same Biology test. Period 2 has 17 students and Period 3 has 15 students. The calculated mean scores, standard deviations, and calculated t-test values are: • Information needed to determine if the test result difference between Per 2 & Per 3 are significantly different or are due to random chance (not significantly different): • df: (17 + 15) -2 = 30 • tcalc: 0.897 • Look at the table of significance • find where the df row for 30 intersects with the 95% Confidence level column (look at the bottom of the table) • That number is tcrit; the threshold/minimum number that has to be met by tcalc( tcrit is 2.042) • tcalc(0.897) is lower than tcrit (2.042), therefore the results are NOT significant and any observed difference is due to random chance
One last question: how confident is the researcher that any observed difference between the 2 groups taking the Ch 51 test is significant? • Look for what number is closest to tcalc in the correct “df” row? • 0.897 is closest to 0.854 • Therefore, the researcher is only 60% confident that the observed difference is significant. • This means, there is a 40% chance that observed differences are due to random chance.
Answers to Practice Questions 1) Is there a significant difference in seedling length in the fresh garlic treatment as compared to the control? YES 2) Explain how you were able to make this determination. Critical t-value: 2.101 & Calculated t-value: 13.9; this calculated t-value is greater than the critical t-value 3) Is there a significant difference in seedling length in the fresh garlic treatment as compared to the crushed sprouted bulb treatment? NO 4) Explain how you were able to make this determination. Critical t-value: 2.101 & Calculated t-value: .33; this calculated t-value is lower than the critical t-value
Cause vs. Correlation • Cause and correlation are terms that are often confused or used incorrectly. • A correlation means a relationship between two or more things: when one increases, the other increases, or when one increases, the other decreases. • A cause is something that results in an effect • For example, heating water to a certain temperature will make it boil. • The crucial point is that a correlation between two things does not necessarily mean that one causes the other. • If there is a relationship between two phenomena, A and B, it could be that A causes B, or it could be that B is responsible for A; • other possibilities are that some other factor is the reason for both A and B, or that they have independent causes that just happen to run in parallel.