Statistical Testing
Statistical Testing. Statistical Testing. Statistical testing randomly selects test cases from the input domain according to the intended usage distribution . Statistical domain testing. Statistical finite state machine (or Markov chain) testing. Statistical control flow testing.

Statistical Testing
E N D
Presentation Transcript
Statistical Testing • Statistical testing randomly selects test cases from the input domain according to the intended usage distribution. • Statistical domain testing. • Statistical finite state machine (or Markov chain) testing. • Statisticalcontrol flow testing. • Statisticaldata flow testing.
Uses of Usage Distributions • Productivity improvement and schedule gains could be achieved by reducing testing effort for lesser-used parts. • New products can be introduced by implementing highly used features quickly to capture market share and then gradually adding lesser-used features in subsequent releases.
Uses of Usage Distributions • High return on investment: the cost-benefit ratio is reported to be about 1:10. • The use of usage distribution can foster better communications with target customers and help establish and maintain better customer relations.
Better Communications and Relations with Customers • The construction of usage distribution needs the direct or indirect involvement of customers. It is more likely for the software development organization and the customers to appreciate each other’s views and efforts in such a collaborative instead of adversarial environment.
Better Communications and Relations with Customers • The use of usage distribution can help develop more precise product requirements and specifications, which are more likely to satisfy customers’ needs. • Customer and user training can be better focused on those features that the customers use the most instead of esoteric ones more likely to be used by internal users.
Operational Profiles • Proportional domain testing uses operational profiles to maintain usage distributions. • An operational profile is a list of disjoint set of operations and their associated probabilities of occurrence. • It is a quantitative characterization of the way a software system is or will be used.
File type Hits % of total .gif 438536 57.47% .html 128869 16.89% directory 87067 11.41% .jpg 65876 8.63% .pdf 10784 1.41% .class 10055 1.32% .ps 2737 0.36% .ppt 2510 0.33% .css 2008 0.26% .txt 1597 0.21% .doc 1567 0.21% .c 1254 0.16% .ico 849 0.11% Cumulative 753709 98.78% Total 763021 100% An Example Usage frequencies (hits) and probabilities (% of total) for different file types for SMU/SEAS.
Representation of Operational Profiles • It is customary to sort the operations by descending probabilities of usage. • It is common to have quite uneven distribution of usage probabilities, with a few frequently used ones account for most of the usage frequencies. • Related to the uneven distribution of usage probabilities is the probability threshold for individual operations. If some operations have very low probability of usage, we could omit them in the operational profile.
Constructing Operational Profiles • How many operational profiles are enough? • This depends on the homogeneity or similarity of product usage by different customers. • If there are no fundamental differences, one operational profile would be appropriate. • If substantial differences exist, then one operational profile for each individual group of customers would be appropriate.
Generic Methods • Actual measurement of usage at customer installations. • Survey of target customers. • Usage estimation based on expert opinions.
Limitations of Actual Measurement • For new products or new applications, there won’t be in-field customer installations. Therefore, actual measurement would not be possible. • Even if there are in-field customer installations for products, the actual usage information and the environment may contain a substantial amount of business sensitive and proprietary data. Therefore, the customers would not be willing to share the data. • Expensive to implement.
Customer Surveys • Customer surveys can provide more objective and potentially more accurate information than expert opinions. • For products with limited number of customers, the survey might be more manageable. • For mass-market products, the massive user population requires careful planning to reduce the survey cost while maintaining result accuracy.
Expert Opinions • The main advantages of using expert opinions to construct operational profiles are the ready availability of these mostly internal experts and the much lower cost. • Other information sources include many of the existing product and system documentations, and product specifications and relevant standards.
Participants of Operational Profiles • The operational profile should be developed by a combination of system engineers, high-level designers, and test planners, with strong participation from product planning and marketing functions. • The involvement of customers is implicitly assumed here as a primary source of information.
Operational Profile Development Procedure: Musa-1 • One OP is developed for each homogeneous group of users or operations by following five basic steps: • Find the customer profile by defining a complete set of customer categories weighted per a usage factor. • Establish the user profile by defining user types weighted in relation to the customer groups and relative usage rates.
Operational Profile Development Procedure: Musa-1 • Define the system modes and related profile by identifying the sets of operations commonly used together and obtaining their related weights. • Determine the functional profile by identifying individual (high-level) functions and obtaining their related weights based on analysis of the system modes and environment variables.
Operational Profile Development Procedure: Musa-1 • Determine the operational profile by refining high-level functions into detailed operations and obtaining their usage probabilities.
An Example: Customer Profile Customer Type Weight corporation 0.5 government 0.4 education 0.05 other 0.05
An Example: User Profile User User Profile by Customer Type Overall Type ctype com gov edu etc User weight 0.5 0.4 0.05 0.05 Profile end user 0.8 0.9 0.9 0.7 0.84 dba 0.02 0.02 0.02 0.02 0.02 programmer 0.18 _ _ 0.28 0.104 third party _ 0.08 0.08 _ 0.036
Operational Profile Development Procedure: Musa-2 • Musa-1 is suitable for large software systems. • Musa-2 is suitable for smaller products or ones with more homogeneous user population. • One operational profile is constructed for each operational mode, similar to the system mode in Musa-1. • There are 5 generic steps.
Operational Profile Development Procedure: Musa-2 • Identify initiators of operations. • Determine tabular or graphical representation. • Create operations lists. • Determine the occurrence rate. • Determine the occurrence probability.
Identify Initiators of Operations • These initiators include human users as well as other software, hardware, network, etc. • Customer types and user types. • External systems and system under study.
Create Operations Lists • Generate an operations list for each initiator type. • These lists can consolidated into a comprehensive list.
Determine the Occurrence Rate • Actual measurement is typically used to obtain data about the occurrence rate or frequency for individual operations in the above consolidated operations list and tabulated.
Determine the Occurrence Probability • The occurrence rates are normalized to obtain the occurrence probabilities. • The occurrence probabilities satisfy 0 pi 1 and ipi = 1.
An Example • Web usage by a group of users. • Stage 1: Starting the browser with two choices: either on the default starting page or a customized starting page. • Stage 2: All subsequent usage is modeled as one stage, with three choices: following links in visited pages, following bookmarked pages, or a mixture of the two.
An Example Stage 1: Start up Stage 2: Other use Operation sequence Probability default linked 160/200=0.8 linked 0.16 X default bookmarked bookmarked 30/200=0.15 0.03 200/1000=0.2 default mixture 10/200=0.05 default mixture 0.01 customized linked 80/800=0.1 linked 0.08 customized 800/1000=0.8 customized bookmarked bookmarked 160/800=0.2 0.16 Y mixture 560/800=0.7 customized mixture 0.56
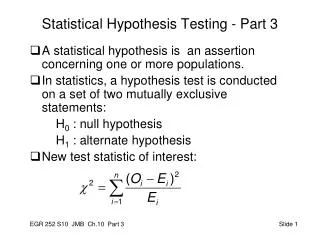
Markov Chains • A Markov chain is a finite state machine with each transition associated with a probability and the set of probabilities satisfies the following two properties: • The probability pij for the transition from state i to state j only depends on the state i, i.e., is history independent. • 0 pij 1 and jpij = 1.
An Example B C A p(B,C) = 1 Mobile Station Initialization Mobile Station Idle p(A,B) = 1 Power-up p(C,B) = 0.01 p(E,B) = 1 p(C,D) = 0.99 p(D,C) = 0.3 Mobile Station Control on Traffic Channel System Access p(D,E) = 0.7 D E
Unified Markov Models • A unified Markov model is a set of hierarchical Markov chains. • A state in a unified Markov model may represent a Markov chain.
An Example p(1,4) = 0.5 E2 E3 E1 Waiting for Mobile Station Answer Traffic Channel Initialization Waiting for Order p(2,3) = 0.9 p(1,2) = 0.5 p(3,5) = 0.05 p(2,5) = 0.1 p(3,4) = 0.95 Arc T_i p(4,3) = 0.5 p(5,3) = 0.2 Release Conversation p(4,5) = 0.5 Arc T_o E5 E4
Thresholds • Overall probability threshold: for complete end-to-end operations to ensure that commonly used complete operation sequences are covered and adequately tested. • State probability threshold: to ensure that frequently visited states are covered and adequately tested. • Transition probability threshold: to ensure that commonly used operation pairs are covered and adequately tested.
An Example B C A p(B,C) = 1 Mobile Station Initialization Mobile Station Idle p(A,B) = 1 Power-up p(C,B) = 0.01 p(E,B) = 1 p(C,D) = 0.99 p(D,C) = 0.3 Mobile Station Control on Traffic Channel System Access p(D,E) = 0.7 D E ABCDE 1 1 0.99 0.7 = 0.693 ABCDEBCDC 1 1 0.99 0.7 1 1 0.99 0.3 = 0.205821