Statistical inference: Hypothesis testing
Statistical inference: Hypothesis testing. Statistical Inference: Brief Overview. Statistics: Learning from Samples about Populations Inference 1 : Confidence Intervals What does the 95% CI really mean? Inference 2 : Hypothesis Tests What does a p-value really mean?

Statistical inference: Hypothesis testing
E N D
Presentation Transcript
Statistical Inference: Brief Overview • Statistics: Learning from Samples about Populations • Inference 1: Confidence Intervals • What does the 95% CI really mean? • Inference 2: Hypothesis Tests • What does a p-value really mean? • When to use which test?
Examples of hypothesis testing in medical research • In epidemiological studies: Is there a relationshipbetween a variable of interest and an outcome of interest? • In example:smoking and lung cancer • stress and thyroid cancer • In clinical trails: Is experimental therapy more effective than standard therapy or placebo?
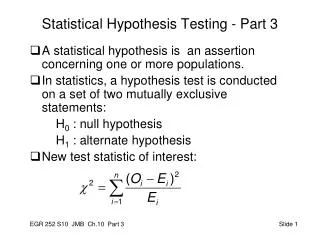
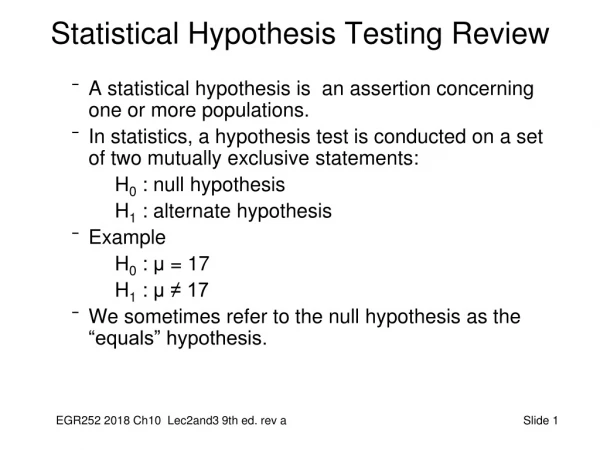
Statistical hypothesis Statements about population parameter values. • Null hypothesis (H0) says a parameter is unchanged from a default, pre-specified value; and • Alternative hypothesis (H1) says parameter has a value incompatible with H0
… …
Example: Hypertension and Cholesterol Make appropriate statistical hypotheses: Assumption: Mean cholesterol in hypertensive men is equal to mean cholesterol in male general population (20-74 years old). Weestimated:In the 20-74 year old male population the mean serum cholesterol is 211 mg/ml with a standard deviation of 46 mg/ml
Example: Hypertension and Cholesterol Null hypothesis => nodifference between treatments • H0: μhypertensive = μgeneral population • H0: μhypertensive = 211 mg/ml • μ -population mean of serum cholesterol • Mean cholesterol for hypertensive men = mean for general male population Alternative hypothesis • HA: μhypertensive≠ μ general population • HA: μ hypertensive≠ 211 mg/ml
Null and alternative hypothesis Two-sidedtests One-sidedtests
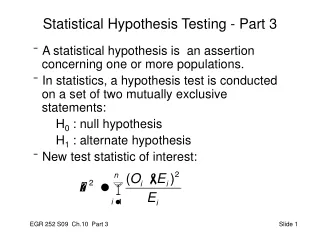
Steps in Hypothesis Tests Assume H0 is true i.e. believe results are a matter of chance Quantify how far away are data from being consistent with H0 by evaluating quantity called atest statistic Assess probability of results at least this extreme - call this the p-value of the test Reject H0 (believe H1) if this p-value is small or keep H0 (do not believe H1) otherwise
Significant difference between the treatments Null hypothesis is rejected, alternative is accepted Interpretation of P-value (0.05) No difference between the treatments (observed difference having happened by chance) Null hypothesis is accepted P>=0.05 P<0.05 5%
P-value The P value gives the probability of observed and more extreme difference having happened by chance. • P = 0.500 means that the probability of the difference having happened by chance is 0.5=50% in 1 ~ 1 in 2. • P = 0.05 means that the probability of the difference having happened by chance is 0.05=5%in 1 ~ 1 in 20.
P-value • The lower the P value, the less likely it is that the difference happened by chance and so the higher the significance of the finding. • P = 0.01 is often considered to be “highly significant”. It means that the difference will only have happened by chance 1 in 100 times. This is unlikely, but still possible.
Example 1 • Out of 50 new babies on average 25 will be girls, sometimes more, sometimes less. • Say there is a new fertility treatment and we want to know whether it affects the chance of having a boy or a girl. • Null hypothesis –the treatment does not alter the chance of having a girl.
Example 1 • Null hypothesis –the treatment does not alter the chance of having a girl. • Out of the first 50 babies resulting from the treatment, 15 are girls. • We need to know the probability that this just happened by chance, i.e. did this happen by chance or has the treatment had an effect on the sex of the babies? • P=0.007
Example 1 • The P value in this example is 0.007. • This means the result would only have happened by chance in 0.007 in 1 (or 1 in 140) times if the treatment did not actually affect the sex of the baby. • This is highly unlikely, so we can reject our hypothesis and conclude that the treatment probably does alter the chance of having a girl.
Example 2 • Patients with minor illnesses were randomized to see either Dr Smith or Dr Jones. Dr Smith ended up seeing 176 patients in the study whereas Dr Jones saw 200 patients.
How to choose the appropriate statistical test? • Type of data (type of variable)? • Number of groups? • Related or independent groups? • Normal or asymmetric distribution?
Example: Hypertension and Cholesterol Make appropriate statistical hypotheses: Mean cholesterol in hypertensive men is 220 mg/ml with a standard deviation of 39 mg/ml. In the 20-74 year old male population the mean serum cholesterol is estimated to 211 mg.
Research hypothesis Statistical hypothesis Hypothesis vsStatictical Hypothesis • Alcohol intake increases driver’s reaction time. • Mean reaction time in examinees drinking alcohol is greater than in nondrinking controls.