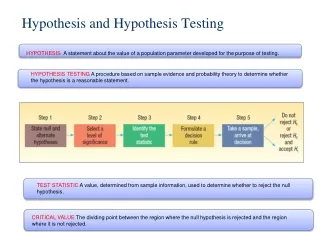
Hypothesis testing and statistical inference
Hypothesis testing and statistical inference. Research Process and Design Spring 2006 Class #10 (Week 11). Today’s objectives. To review elements of last weeks class To understand logic of inferential statistics To explore hypothesis testing

Hypothesis testing and statistical inference
E N D
Presentation Transcript
Hypothesis testing and statistical inference Research Process and Design Spring 2006 Class #10 (Week 11)
Today’s objectives • To review elements of last weeks class • To understand logic of inferential statistics • To explore hypothesis testing • To get feedback on first draft of methods section Research Process and Design (Umbach)
Logic of Inferential Statistics • Hope to say something with confidence about the population based on a sample • Use probabilities to state the degree of confidence Research Process and Design (Umbach)
Probability samples and standard errors • Random selection • Human influence is removed from the selection process • E.g., dice, random number generator • Probability samples use random selection to draw a subset of the sampling frame • Sampling error arises because of this • Standard errors allow us to quantify this error Research Process and Design (Umbach)
Laws of Sampling Theory • Whenever a random sample is taken from a population there will be sampling error. • If sample is truly random, then characteristics of sample will be an unbiased estimate of population characteristics. • As sample size increases, the range (the size) of sampling error decreases. Research Process and Design (Umbach)
Central Limit Theorem • The sampling distribution, or the distribution of the sampling error for any sample drawn from a given population, approximates a normal curve. • Standard error - standard deviation of the sample estimates of means that would be formed if an infinite number of samples. Research Process and Design (Umbach)
Standard error • Relies on the concept of repeated samples from a population • Due to chance, the means of these samples will vary around the population mean • We can measure this variance and determine how much the typical sample will deviate from the population mean (i.e., the standard deviation or SD) • This SD is the standard error (SE) • http://www.ruf.rice.edu/~lane/stat_sim/sampling_dist/index.html Research Process and Design (Umbach)
Standard errors • Standard error of the mean: • s is the SD from our sample; n is sample size • We can see that as n increases, SE decreases • Different formulas for different statistics (proportions, comparing two means, etc.), but they have a similar form Research Process and Design (Umbach)
Confidence Intervals • The range within which the parameter in question could be expected to be included a specified percentage of the time if procedure were to be repeated. C = Z statistic associated with the confidence level; 1.96 corresponds to the .95%, 2.33 corresponds to the 98% level, and 2.58 corresponds to the 99% confidence level Research Process and Design (Umbach)
Standard errors • Confidence intervals (CI) use SE and tell us the precision of our estimates • 95% CI for a mean = • Very specific definition: if we calculated similar CIs on 100 similar samples, 95% of them would bracket the population parameter • Does not mean there is a 95% probability that population parameter falls in your CI – either it does or it doesn’t • http://www.ruf.rice.edu/~lane/stat_sim/conf_interval/ Research Process and Design (Umbach)
Standard errors • Margin of error in polls is a confidence interval, usually a 95% CI Research Process and Design (Umbach)
Central Limit Theorem • The sampling distribution, or the distribution of the sampling error for any sample drawn from a given population, approximates a normal curve. • Standard error - standard deviation of the sample estimates of means that would be formed if an infinite number of samples is known as the standard error. Research Process and Design (Umbach)
Confidence Intervals and Hypothesis Testing • The range within which the parameter in question could be expected to be included a specified percentage of the time if procedure were to be repeated. C = Z statistic associated with the confidence level; 1.96 corresponds to the .95%, 2.33 corresponds to the 98% level, and 2.58 corresponds to the 99% confidence level Research Process and Design (Umbach)
Normal Curve • Symmetric around mean • Skewness • Positively skewed • Negatively skewed • Kurtosis • Leptokurtic • Platykurtic Research Process and Design (Umbach)
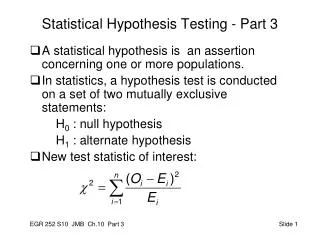
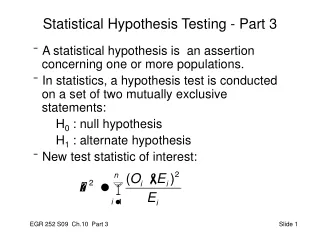
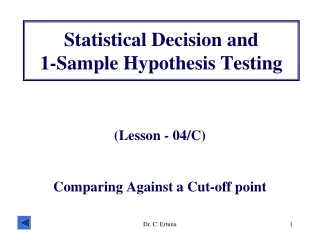
Hypotheses • How do we know that differences between groups are not due to sampling error? How big does a correlation need to be to know that difference is real and not a result of sampling error? • Hypothesis testing? • How do we develop hypotheses? • Null hypothesis • Research (or alternative) hypothesis Research Process and Design (Umbach)
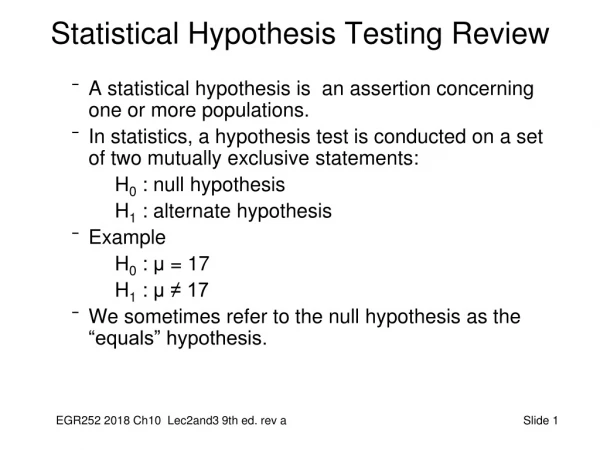
Statistical Hypotheses—Null Hypothesis (H0) • Statistical statement of no difference in population • No difference between performance of a group and accepted benchmark • e.g., passing a test Research Process and Design (Umbach)
Statistical Hypotheses—Null Hypothesis (H0) • No difference between two or more groups that are being compared • e.g., experimental and comparison groups • No relationship between or among predictor and criterion variables • e.g., relationship between attitude and achievement does not exist; it is not different from zero Research Process and Design (Umbach)
Statistical Hypotheses--Alternative hypothesis (H1) • Statistical statement that includes all results not explicitly stated in the null hypothesis • Reflects the existence of differences or relationships • The performances of students in the experimental group exceeds the performances of those in the comparison group • A relationship between attitude and achievement does exist • Usually reflects the research hypothesis Research Process and Design (Umbach)
Choice of probability level • Rejection region or significance level • p<.10,p<.05, p<.01, p<.001 • Determined a priori • Significance • Interpreting results • One-tailed test • Two-tailed test Research Process and Design (Umbach)
Error in hypothesis testing State of Nature Research Process and Design (Umbach)
Feedback on the method section • Do you have all of the information you need to fully assess the method? What do you need? • Is the study feasible as described in the method? • How is the study (1)Maximizing experimental variation, (2)Minimizing Error Variation, and (3) Controlling Extraneous (Confounding) Variation Don’t hesitate to ask the other group for help in areas where you are having trouble. Research Process and Design (Umbach)
In two weeks… • Analysis of variance (ANOVA) • Reading for next week: • Jaeger – Chapters 12-14 • Assignment due: Draft of proposal. Bring 3 copies to class. • NO CLASS NEXT WEEK. Work on proposals. Research Process and Design (Umbach)