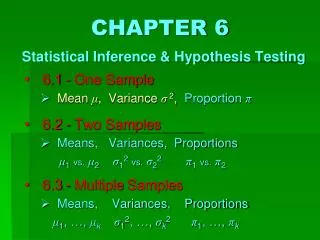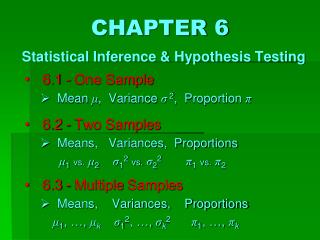
Chapter 8: Testing Statistical Hypothesis
Chapter 8: Testing Statistical Hypothesis. http://www.rmower.com/statistics/Stat_HW/0801HW_sol.htm. Hypothesis: Examples. Parameter: π = proportion of cats that are long haired. Hypothesis: π < 0.40 (40%) Parameter(s):


Chapter 8: Testing Statistical Hypothesis
E N D
Presentation Transcript
Chapter 8: Testing Statistical Hypothesis http://www.rmower.com/statistics/Stat_HW/0801HW_sol.htm
Hypothesis: Examples • Parameter: π = proportion of cats that are long haired. Hypothesis: π < 0.40 (40%) • Parameter(s): μ1 = true average caloric intake of teens who don’t eat fast food. μ2 = true average caloric intake of teens who do eat fast food. Hypothesis: μ1 – μ2 < -200 (calories)
Math Hypotheses: Examples (1) Translate each of the following research questions into appropriate hypothesis. 1. The census bureau data show that the mean household income in the area served by a shopping mall is $62,500 per year. A market research firm questions shoppers at the mall to find out whether the mean household income of mall shoppers is higher than that of the general population. 2. Last year, your company’s service technicians took an average of 2.6 hours to respond to trouble calls from business customers who had purchased service contracts. Do this year’s data show a different average response time?
Math Hypotheses: Examples (2) Translate each of the following research questions into appropriate hypothesis. 3. The drying time of paint under a specified test conditions is known to be normally distributed with mean value 75 min and standard deviation 9 min. Chemists have proposed a new additive designed to decrease average drying time. It is believed that the new drying time will still be normally distributed with the same σ = 9 min. Should the company change to the new additive?
Hypothesis testing: example Suppose we are interested in how many credit cards that people own. Let’s obtain a SRS of 100 people who own credit cards. In this sample, the sample mean is 4 and the sample standard deviation is 2. If someone claims that he thinks that μ = 2, is that person correct? a) Construct a 95% CI for μ. b) To a hypothesis test.
Procedure for Hypothesis Testing 1. Identify the parameter(s) of interest and describe it in the context of the problem situation. 2. State the Hypotheses. 3. Determine an appropriate α level. 4. Calculate the appropriate test statistic. 5. Find the P-value. 6. Reject H0 or fail to reject H0 and why. 7. State the conclusion in the problem context. The data does [not] give strong support (P-value = [x]) to the claim that the [statement of Ha].
Hypothesis Testing: Example In a random sample of 100 light bulbs, 7 are found defective. Is this compatible with the manufacturer’s claim of only 5% of the light bulbs produced are defective? Use an α = 0.01.
Single mean test: Example 1 A group of 15 male executives in the age group 35 – 44 have a mean systolic blood pressure of 126.07 and standard deviation of 15. Is this career group’s mean pressure different from that of the general population of males in this age group which have a mean systolic blood pressure of 128?
Single mean test: Example 2 A new billing system will be cost effective only if the mean monthly account is more than $170. Accounts have a standard deviation of $65. A survey of 41 monthly accounts gave a mean of $187. Will the new system be cost effective? What would the conclusion be if the monthly accounts gave a mean of $160?
Single mean test: Summary Null hypothesis: H0: μ = μ0 Test statistic:
Difference between two means test (independent): Summary Null hypothesis: H0: μ1 – μ2 = Δ Test statistic: Note: If we are determining if the two populations are equal, then Δ = 0
Two-sample t-test round DOWN to the nearest integer
Difference between two means test (independent): Example A group of 15 college seniors are selected to participate in a manual dexterity skill test against a group of 20 industrial workers. Skills are assessed by scores obtained on a test taken by both groups. The data is shown in the following table: Conduct a hypothesis test to determine whether the industrial workers had better manual dexterity skills than the students at the 0.05 significance level. Compare with the 95% CI previously calculated.
Difference between two means test (paired): Summary Null hypothesis: H0: μD = Δ Test statistic:
Difference between two means test (paired): Example In an effort to determine whether sensitivity training for nurses would improve the quality of nursing provided at an area hospital, the following study was conducted. Eight different nurses were selected and their nursing skills were given a score from 1 to 10. After this initial screening, a training program was administered, and then the same nurses were rated again. Below is a table of their pre- and post-training scores.
Example: Paired t-test • Conduct a test to determine whether the training could on average improve the quality of nursing provided in the population. • Compare with the 95% CI previously calculated.
2 distribution http://cnx.org/content/m13129/latest/chi_sq.gif
2 distribution: Example In the sweet pea, the allele for purple flower color (P) is dominant to the allele for red flowers (p), and the allele for long pollen grains (L) is dominant to the allele for round pollen grains (l). The first group (of grandparents) will be homozygous for the dominant alleles (PPLL) and the second group (of grandparents) will be homozygous for the recessive alleles (ppll) Are these 25.5 cM apart? πPL(1) = 0.66, πPl(2) = 0.09, πpL(3) = 0.09, πpl(4) = 0.16 Observations: 381 F2 offspring 284 purple/long, 21 purple/round, 21 red/long, 55 red/round
Homogeneity: Example A certain population of people can be classified by their hair color and eye color. For this population, the possible choices for hair color are Brown, Black, Fair and Red and the possible choices of eye color are brown, grey/green and blue.
Homogeneity: Example A certain population of people can be classified by their hair color and eye color. For this population, the possible choices for hair color are Brown, Black, Fair and Red and the possible choices of eye color are brown, grey/green and blue. Cary out a 2 test at level 0.01 to see if the eye color in this population is associated with the hair color.