Introduction to Inference: Confidence Intervals and Hypothesis Testing
180 likes | 389 Vues
Presentation 8. First Part. Introduction to Inference: Confidence Intervals and Hypothesis Testing. What is inference?. Inference is when we use a sample to make conclusions about a population. . 2. Describe the SAMPLE. 1. Draw a Representative SAMPLE from the POPULATION.

Introduction to Inference: Confidence Intervals and Hypothesis Testing
E N D
Presentation Transcript
Presentation 8 First Part Introduction to Inference:Confidence Intervalsand Hypothesis Testing
What is inference? Inference is when we use a sample to make conclusions about a population. 2. Describe the SAMPLE 1. Draw a Representative SAMPLE from the POPULATION 3. Use Rules of Probability and Statistics to make Conclusions about the POPULATION from the SAMPLE.
Population Parameters • p = population proportion • µ = population mean • σ = population standard deviation • β1= population slope (we will see this in Ch. 14) Sample Statistics • = sample proportion • = sample mean • s = sample standard deviation • b1 = sample slope (we will see this in Ch. 14)
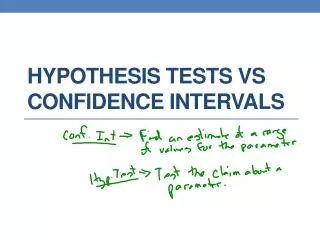
Two Types of Inference • Confidence Intervals: (Ch. 10 & 12) • Confidence Intervals give us a range in which the population parameter is likely to fall. • We use confidence intervals whenever the research question calls for an estimation of a population parameter. Example: What is the mean age of trees in the forest? Estimate the proportion of US adults who would vote for candidate A. 2. Hypothesis Testing: (Ch. 11 & 13) • Hypothesis tests are tests of population parameters. Example: Is the proportion of US adult women who would vote for candidate A >50%? • We can only prove that a population parameter is ‘different’ than our null value. We cannot prove that a population parameter is equal to some value. Valid Hypothesis: Is the mean age of trees in the forest > 50 years? Invalid Hypothesis: Is the mean age of trees in the forest equal to 50 years?
Types of CIs and Hypothesis Tests For Hypothesis Tests and C.I.’s: • 1-proportion (1-categorical variable) • 1-mean (1-quantitative variable) • Difference in 2 proportions (2-categorical variables, both with 2 levels) • Difference in 2 means (1-quantitative and 1-categorical variable, or 2-quantitative variables, independent samples) • Regression, Slope (2-quantitative variables) For Hypothesis Tests only: • Chi-Square Test (2-categorical variables, at least one with 3 or more levels!)
Some Examples… • Mike wants to estimate the mean high-school GPA of incoming freshman at Penn State. Solution- CI for one population mean. • George wants to know if the proportion of students who engage in under age drinking is greater than 25%. Solution- Test of one proportion Ho: p ≤ .25 Ha: p > .25 • Doug wants to estimate the difference in the proportion of men and women who smoke. Solution- CI for difference in 2-proportions.
Interpreting CI and Hypothesis Testing • Confidence Intervals: Given the confidence level, β= 90%, 95%, 99%, etc conclude that with β % confidence the population parameter is within the confidence interval. Example: Suppose the 90% CI for age of trees in the forest is (32,45) years. Then, we are 90% confident that the true mean age of trees in the forest is between 32 and 45 years. • Hypothesis Testing: Use the p-value to determine whether we can reject the null hypothesis. We do not need to know the exact definition now, or how to calculate the p-value, but generally the p-value is a measure of how consistent the data is with the null hypothesis. A small p-value (<.05) indicates the data we obtained was UNLIKELY under the null hypothesis. Decision Rule: If the p-value is <.05 we REJECT the null hypothesis, and accept the alternative. We have a statistically significant result! If the p-value is >.05 then we say that we do NOT have enough evidence to reject the null hypothesis.
Second Part Confidence Intervalsfor 1-Proportion
Review of Ch.9: Sample Proportion • If np and n(1-p) are greater or equal to 10, the sampling distribution of is approximately normal with mean p and standard deviation .
From Sampling Distributions to Confidence Intervals… • The sample proportion will fall close to the true proportion. • Thus the true proportion is likely to be close to the observed sample proportion. How close? • 95% of the would be expected to fall within ± 2 standard deviations of the true proportion p. • So if we were to construct intervals around ‘s with a width of ± 2 standard deviations these intervals would contain the TRUE population proportion 95% of the times!
Margin of Error & C.I. • is an estimator of p but it is not exactly equal to p. • How far is from p? • Margin of Error is a measure of accuracy providing a likely upper limit for the difference between and p. • This difference is almost always less that the Margin of Error. • The almost always is translated with large probability. Usually we are talking about 90%, 95% or 99% probability. • This probability is the confidence level. For example, if the confidence level is 95%, it means that 95% of the times the difference between and p is less than the Margin of Error. (i.e. we expect 38 out of 40 samples to give a such that its difference with p is less than the Margin of Error.) • Example: Based on a sample of 1000 voters, the proportion of voters who favor candidate A are 34% with a 3% Margin of Error based on a 95% confidence level. What does this tell us?
95% C.I. for 1-proportion (Derivation) • If np and n(1-p) are ≥ 10, the sampling distribution of is approximately normal with mean p and standard deviation • From the empirical rule we have that for about 95% of the samples, is going to fall within from p, i.e. with 95% probability we have • There is a problem here! Since p is the unknown parameter of interest, is also unknown. Thus, we substitute with the . Doing so we have that if are both ≥10, then with 95% probability we have
95% Margin of Error and C.I. for p • Thus, if the 95% Margin of Error is and the 95% C.I. for p is Note that we are using instead of p for the condition!
A sample of 1200 people is polled to determine the percentage that are in favor of candidate A. Suppose 580 say they are in favor. Construct a 95% CI for the true population proportion. So the 95% CI for p is: Conclusion: We are 95% confident that the true population proportion of those who support candidate A is between 45.5% and 51.2%. Example 1: Obtaining a 95% C.I. for p.
Any C.I. for 1-proprtion • Conditions: We need to have • β% CI for p : • z* multiplier depends on the desired confidence level, β%. • z* is such that P(-z*<Z<z*)= β%. The most common multipliers are • Interpretation: We are β% confident that the true population proportion, p, is contained within the confidence interval. Another interpretation is that for about β% samples from the population, the CI captures p. Margin of Error=z* times the std. error
Example 2: Obtaining a 99% C.I. for p. 300 high-risk patients received an experimental AIDS vaccine. The patients were followed for a period of 5 years and ultimately 53 came down with the virus. Assuming all patients were exposed to the virus, construct a 99% CI for the proportion of individuals protected. We have that the 99% CI for p is: where z*= 2.58. (Can you see why using the Normal table?) So the 99% CI for p = .823 ± 2.58(.0220) = (.767,.880) We are 99% confident that the true proportion of those protected by the vaccine is between 76.7% and 88.0%.
The Width of a Confidence Interval is affected by: n as the sample size increases the standard error of decreases and the confidence interval gets smaller. So a larger sample size gives us a more precise estimate of p. z* as the confidence level increases (β%), the multiplier z* increases, leading to a wider CI. So, if we want to control the length of the C.I. we can either adjust the confidence level or the sample size...
Question: What is an appropriate size in order to obtain a C.I. of a 95% confidence level that is not very large (i.e. with small Margin of Error)? • The Margin of Error for 95% CI is equal to 2 x s.e( ). • Before collecting the sample, is unknown, thus we cannot calculate the exact Margin of Error. • A conservative Margin of Error is equal to • This implies that differs from p at most ___________ . • Using the conservative Margin of Error, the length of the C.I. is equal to _____________. • How large should n beto get a 95% CI of some length L? n=___________.