Download
1 / 10
100 likes | 197 Vues
Learn how to analyze survey results using hypothesis tests and confidence intervals in AP Statistics projects and employee studies. Understand the difference and significance of test statistics and confidence intervals. Interpret Minitab outputs for conclusive insights.

E N D
According to the CDC Web site, 50% of high school students have never smoked a cigarette. Mary wonders whether this national result holds true in her large urban high school. For her AP Stats class project, Mary surveys a SRS of 150 students from her school. She gets responses from all 150 students, and 90 say that they have never smoked a cigarette. What should Mary conclude? Use a 5% significance level.
According to the CDC Web site, 50% of high school students have never smoked a cigarette. Mary wonders what the percentage is in her large urban high school. For her AP Stats class project, Mary surveys a SRS of 150 students from her school. She gets responses from all 150 students, and 90 say that they have never smoked a cigarette. Construct a 95% confidence interval to estimate the proportion of students in Mary’s school who have never smoked.
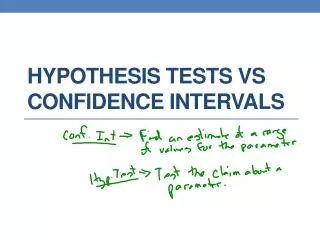
Two Tailed Test with a 5% significance level is similar to a 95% confidence level, but what is different?
What makes them Different? • In the Hypothesis Test you are testing the hypotheses: • If you reject the null hypothesis, all you know is that the proportion who smoke is not 50%. • The confidence interval is much more informative. We get possible values of the proportion who smoke and we can tell that 50% is not likely.
The 95% interval gives an approximate range of po’s that would not be rejected by a two-sided test at the 5% significance level. • The link is not perfect because the standard error used for the confidence interval is based on the sample proportions while the denominator of the test statistic is based on the population proportion. Test Statistic Confidence Interval
According to the National Institute for Occupational Safety and Health, job stress poses a major threat to the health of workers. In a national survey of restaurant employees, 75% said that work stress had a negative impact on their personal lives. Managers of a large restaurant chain wonder whether this national result holds for their employees. A random sample of 100 employees finds that 68 answer “Yes” when asked, “Does work stree have a negative impact on your personal life?” Is this a good reason to think that the proportions of all employees in this chain who would say “Yes” differs from the national proportion of 0.75?
The figure below shows Minitab output from a significance test and confidence interval for the restaurant worker data on the previous slide. Explain how the confidence interval is consistent with, but gives more information that the test.
Homework • p. 587 (64-74)even (79-83)