The logic behind a statistical test.
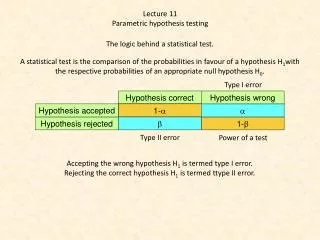
Lecture 11 Parametric hypothesis testing. The logic behind a statistical test. A statistical test is the comparison of the probabilities in favour of a hypothesis H 1 with the respective probabilities of an appropriate null hypothesis H 0 . Type I error. Type II error.

The logic behind a statistical test.
E N D
Presentation Transcript
Lecture11 Parametrichypothesistesting Thelogicbehind a statistical test. A statistical test isthecomparison of theprobabilitiesinfavour of a hypothesis H1with therespectiveprobabilities of an appropriatenullhypothesis H0. Type I error Type II error Power of a test Acceptingthewronghypothesis H1istermedtype I error. Rejectingthe correct hypothesis H1istermedttype II error.
Testing simple hypotheses Karl Pearson threw 24000 times a coin and wanted to see whether in the real world deviations from the expectation of 12000 numbers and 12000 eagles occur. He got 12012 time the numbers. Does this result deviate from our expectation? Theexactsolution of thebinomial Thenormalapproximation
c2 test Assume a sum of variances of Z-transformedvariables Eachvarianceis one. Thustheexpectedvalue of c2is n Thec2distributionis a group of distributions of variancesindependence on thenumber of elements n. Observedvalues of c2can be compared to predicted and allow for statisticalhypthesistesting. Pearson’scoinexample Probability of H0
Doestheobservationconfirmtheprediction? 9 timesgreen, yellowseed 3 timesgreen, greenseed 3 timesyellow, yellowseed 1 time yellow, greenseed The Chi2 test has K-1 degrees of freedom.
All statisticalprogramsgivetheprobability of thenullhypothesis, H0.
Advices for applying a χ2-test • χ2-tests compare observations and expectations. Total numbers of observations and expectationsmust be equal. • The absolute values should not be too small (as a rule the smallest expected value should be larger than 10). At small event numbers the Yates correction should be used. • The classification of events must be unequivocal. • χ2-tests were found to be quite robust. That means they are conservative and rather favour H0, the hypothesis of no deviation. • The applicability of the χ2-test does not depend on the underlying distributions. They need not to be normally of binomial distributed. Dealingwithfrequencies
1000 Drosophilaflieswithnormal and curledwings and twoalleles A and B suposed to influence wing form. Predictednumber of allele A and curledwings 2x2 contingency table Do flieswith allele havemoreoftencurledwingsthanfielswith allele B? A contingencytable chi2 test with n rows and m columnshas (n-1) * (m-1) degrees of freedom. The 2x2 tablehas 1 degree of freedom
Bivariatecomparisons of means Student’st-testfor equalsamplesizes and similarvariances Welch t-testfor unequalvariances and samplesizes F-test
In a physiological experiment mean metabolism rates had been measured. A first treatment gave mean = 100, variance = 45, a second treatment mean = 120, variance = 55. In the first case 30 animals in the second case 50 animals had been tested. Do means and variances differ? N1+N2-2 Degrees of freedom Theprobabilitylevel for thenullhypothesis
Thecomparison of variances Theprobability for thenullhypothesis of no difference, H0. 1-0.287=0.713: probabilitythatthe first variance (50) islargerthanthesecond (30). One sided test Degrees of freedom: N-1 0.57 2*0.287 Past givestheprobability for a twosided test that one varianceiseitherlargerorsmallerthanthesecond. Twosided test
Power analysis Effectsize In an experiment you estimated two means Each time youtook 20 replicates. Was this sample size large enough to confirm differences between both means? We usethet-distributionwith 19 degrees of freedom. Youneeded 15 replicates to confirm a differenceatthe 5% errorlevel.
From a physiological experiment we want to test whether a certain medicament enhances short time memory. How many persons should you test (with and without the treatment) to confirm a difference in memory of about 5%? We don’tknowthevariances and assume a Poisson random sample. Hence s2 = m Thet-testcan be used to estimatethenumber of observations to detect a significantsignal for a giveneffectsize. We don’tknowthedegrees of freedom: We use a largenumber and get t:
Correlation and linearregression Theleastsquaresmethod of Carl Friedrich Gauß. OLRy y = ax + b Dy2 Dy
Covariance Variance Correlation coefficient Slope a and coefficient of correlationrare zero ifthecovarianceis zero. Coefficient of determination
Relationshipsbetweenmacropterous, dimorphic and brachypterousgroundbeetles on 17 Mazurianlakeislands Positivecorrelation; r =r2= 0.41 Theregressionisweak. Macropterousspeciesrichnessexplainsonly 17% of thevarianceinbrachypterousspeciesrichness. We havesomeislandswithoutbrachypterousspecies. We reallydon’tknowwhatisthe independent variable. Thereis no clear cutlogicalconnection. Positivecorrelation; r =r2= 0.67 Theregressionismoderate. Macropterousspeciesrichnessexplainsonly 45% of thevarianceindimorphicspeciesrichness. Therelationshipappears to be non-linear. Log-transformationisindicated (no zero counts). We reallydon’tknowwhatisthe independent variable. Thereis no clear cutlogicalconnection.
Negative correlation; r =r2= -0.48 The regression is weak. Island isolation explains only 23% of the variance in brachypterous species richness. We have two apparent outliers. Without them the whole relationship would vanish, it est R2 0. Outliers have to be eliminated fom regression analysis. We have a clear hypothesis about the logical relationships. Isolation should be the predictor of species richness. No correlation; r =r2= 0.06 The regression slope is nearly zero. Area explains less than 1% of the variance in brachypterous species richness. We have a clear hypothesis about the logical relationships. Area should be the predictor of species richness.
Whatdistance to minimize? OLRy Dy2 OLRx Dx2 Model I regression
RMA Dx Dy Reduced major axis regressionisthegeometricaverage of aOLRy and aOLRx Model II regression
Past standard output of linearregression Reduced major axis Parameters and standard errors Parametricprobability for r = 0 Permutation test for statisticalsignificance Bothtestsindicatethat Brach and Macroare not significantlycorrelated. The RMA regressionslopeisinsignificant. We don’thave a clear hypothesisaboutthecausalrelationships. In thiscase RMA isindicated.
Permutation test for statisticalsignificance g > 0 Observedr S N2.5 = 25 S N2.5 = 25 m > 0 Upper CL Lower CL Calculatingconfidencelimits Rankall 1000 coefficients of correlation and takethevaluesatrankpositions 25 and 975. Randomize 1000 times x or y. Calculateeach time r. Plot thestatisticaldistribution and calculatethelower and upperconfidencelimits.
The RMA regressionhas a much steeperslope. Thisslopeisoftenintuitivelybetter. Upper CL Thecoefficient of correlationis independent of theregressionmethod Lower CL In OLRyregressioninsignificance of slopemeansalsoinsignificance of r and R2. The 95% confidence limit of theregressionslope markthe 95% probabilitythattheregressionslopeiswithintheselimits. Thelower CL isnegative, hencethe zero slopeiswiththe 95% CL.
Outliershave an overproportional influence on correlation and regression. OLRy Dy2 Dy Outliersshould be eliminatedfromregressionanalysis. rPearson = 0.79 Normalcorrelation on ranked data Instead of the Pearson coefficient of correlationsuseSpearman’srank order correlation. rSpearman = 0.77
Home work and literature • Refresh: • Coefficient of correlation • Pearson correlation • Spearmancorrelation • Linearregression • Non-linearregression • Model I and model II regression • RMA regression • Prepare to thenextlecture: • F-test • F-distribution • Variance Literature: Łomnicki: Statystyka dla biologów http://statsoft.com/textbook/