Statistical Intervals for a Single Sample
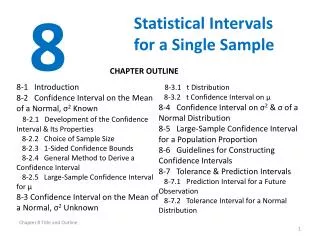
8. Statistical Intervals for a Single Sample. CHAPTER OUTLINE. 8-1 Introduction 8-2 Confidence Interval on the Mean of a Normal, σ 2 Known 8-2.1 Development of the Confidence Interval & Its Properties 8-2.2 Choice of Sample Size 8-2.3 1-Sided Confidence Bounds

Statistical Intervals for a Single Sample
E N D
Presentation Transcript
8 Statistical Intervals for a Single Sample CHAPTER OUTLINE 8-1 Introduction 8-2 Confidence Interval on the Mean of a Normal, σ2 Known 8-2.1 Development of the Confidence Interval & Its Properties 8-2.2 Choice of Sample Size 8-2.3 1-Sided Confidence Bounds 8-2.4 General Method to Derive a Confidence Interval 8-2.5 Large-Sample Confidence Interval for μ 8-3 Confidence Interval on the Mean of a Normal, σ2 Unknown 8-3.1 t Distribution 8-3.2 t Confidence Interval on μ 8-4 Confidence Interval on σ2 & σ of a Normal Distribution 8-5 Large-Sample Confidence Interval for a Population Proportion 8-6 Guidelines for Constructing Confidence Intervals 8-7 Tolerance & Prediction Intervals 8-7.1 Prediction Interval for a Future Observation 8-7.2 Tolerance Interval for a Normal Distribution Chapter 8 Title and Outline
Learning Objectives for Chapter 8 After careful study of this chapter, you should be able to do the following: • Construct confidence intervals on the mean of a normal distribution, using either the normal distribution or the t distribution method. • Construct confidence intervals on the variance and standard deviation of a normal distribution. • Construct confidence intervals on a population proportion. • Use a general method for constructing an approximate confidence interval on a parameter. • Construct prediction intervals for a future observation. • Construct a tolerance interval for a normal population. • Explain the three types of interval estimates: Confidence intervals, prediction intervals, and tolerance intervals. Chapter 8 Learning Objectives
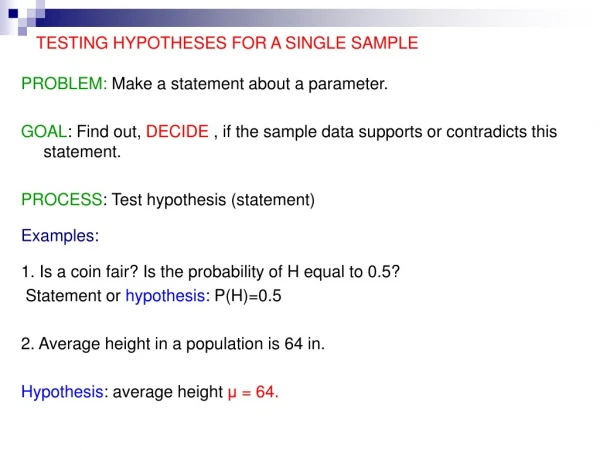
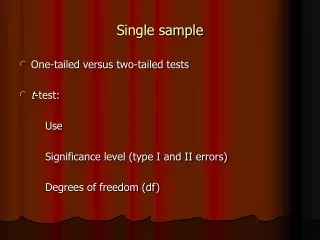
8-1 Introduction • In the previous chapter we illustrated how a parameter can be estimated from sample data. However, it is important to understand how good is the estimate obtained. • Bounds that represent an interval of plausible values for a parameter are an example of an interval estimate. • Three types of intervals will be presented: • Confidence intervals • Prediction intervals • Tolerance intervals
8-2 Confidence Interval on the Mean of a Normal Distribution, Variance Known 8-2.1 Development of the Confidence Interval and its Basic Properties (Eq. 8-1)
8-2 Confidence Interval on the Mean of a Normal Distribution, Variance Known 8-2.1 Development of the Confidence Interval and its Basic Properties (Eq. 8-2 & 3)
8-2 Confidence Interval on the Mean of a Normal Distribution, Variance Known • 8-2.1 Development of the Confidence Interval and its Basic Properties (Eq. 8-4) • The endpoints or bounds l and u are called lower- and upper-confidence limits, respectively. • Since Z follows a standard normal distribution, we can write:
8-2 Confidence Interval on the Mean of a Normal Distribution, Variance Known 8-2.1 Development of the Confidence Interval and its Basic Properties (Eq. 8-5) Definition
8-2 Confidence Interval on the Mean of a Normal Distribution, Variance Known Example 8-1
8-2 Confidence Interval on the Mean of a Normal Distribution, Variance Known • Interpreting a Confidence Interval • The confidence interval is a random interval • The appropriate interpretation of a confidence interval (for example on ) is: The observed interval [l, u] brackets the true value of , with confidence 100(1-). • Examine Figure 8-1 on the next slide.
8-2 Confidence Interval on the Mean of a Normal Distribution, Variance Known Figure 8-1Repeated construction of a confidence interval for .
8-2 Confidence Interval on the Mean of a Normal Distribution, Variance Known Confidence Level and Precision of Error The length of a confidence interval is a measure of the precision of estimation. Figure 8-2Error in estimating with .
8-2 Confidence Interval on the Mean of a Normal Distribution, Variance Known 8-2.2 Choice of Sample Size (Eq. 8-6) Definition
8-2 Confidence Interval on the Mean of a Normal Distribution, Variance Known Example 8-2
8-2 Confidence Interval on the Mean of a Normal Distribution, Variance Known 8-2.3 One-Sided Confidence Bounds (Eq. 8-7 & 8) Definition
8-2 Confidence Interval on the Mean of a Normal Distribution, Variance Known 8-2.4 General Method to Derive a Confidence Interval
8-2 Confidence Interval on the Mean of a Normal Distribution, Variance Known 8-2.4 General Method to Derive a Confidence Interval (Eq. 8-9 & 10)
8-2 Confidence Interval on the Mean of a Normal Distribution, Variance Known 8-2.4 General Method to Derive a Confidence Interval
8-2 Confidence Interval on the Mean of a Normal Distribution, Variance Known 8-2.5 A Large-Sample Confidence Interval for (Eq. 8-11) Definition
8-2 Confidence Interval on the Mean of a Normal Distribution, Variance Known Example 8-4
8-2 Confidence Interval on the Mean of a Normal Distribution, Variance Known Example 8-4 (continued)
8-2 Confidence Interval on the Mean of a Normal Distribution, Variance Known Example 8-4 (continued) Figure 8-3Mercury concentration in largemouth bass (a) Histogram. (b) Normal probability plot
8-2 Confidence Interval on the Mean of a Normal Distribution, Variance Known Example 8-4 (continued)
8-2 Confidence Interval on the Mean of a Normal Distribution, Variance Known A General Large Sample Confidence Interval (Eq. 8-12)
8-3 Confidence Interval on the Mean of a Normal Distribution, Variance Unknown 8-3.1 The t distribution (Eq. 8-13)
8-3 Confidence Interval on the Mean of a Normal Distribution, Variance Unknown 8-3.1 The t distribution Figure 8-4Probability density functions of several t distributions.
8-3 Confidence Interval on the Mean of a Normal Distribution, Variance Unknown 8-3.1 The t distribution Figure 8-5Percentage points of the t distribution.
8-3 Confidence Interval on the Mean of a Normal Distribution, Variance Unknown 8-3.2 The t Confidence Interval on (Eq. 8-16) One-sided confidence bounds on the mean are found by replacing t/2,n-1 in Equation 8-16 with t,n-1.
8-3 Confidence Interval on the Mean of a Normal Distribution, Variance Unknown Example 8-5
8-3 Confidence Interval on the Mean of a Normal Distribution, Variance Unknown Figure 8-6Box and Whisker plot for the load at failure data in Example 8-5.
8-3 Confidence Interval on the Mean of a Normal Distribution, Variance Unknown Figure 8-7Normal probability plot of the load at failure data in Example 8-5.
8-4 Confidence Interval on the Variance and Standard Deviation of a Normal Distribution Definition (Eq. 8-17)
8-4 Confidence Interval on the Variance and Standard Deviation of a Normal Distribution Figure 8-8Probability density functions of several 2 distributions.
8-4 Confidence Interval on the Variance and Standard Deviation of a Normal Distribution Definition (Eq. 8-19)
8-4 Confidence Interval on the Variance and Standard Deviation of a Normal Distribution One-Sided Confidence Bounds (Eq. 8-20)
8-4 Confidence Interval on the Variance and Standard Deviation of a Normal Distribution Example 8-6
8-5 A Large-Sample Confidence Interval For a Population Proportion Normal Approximation for Binomial Proportion The quantity is called the standard error of the point estimator .
8-5 A Large-Sample Confidence Interval For a Population Proportion (Eq. 8-23)
8-5 A Large-Sample Confidence Interval For a Population Proportion Example 8-7
8-5 A Large-Sample Confidence Interval For a Population Proportion Choice of Sample Size (Eq. 8-24 & 25) The sample size for a specified value E is given by An upper bound on n is given by
8-5 A Large-Sample Confidence Interval For a Population Proportion Example 8-8
8-5 A Large-Sample Confidence Interval For a Population Proportion One-Sided Confidence Bounds (Eq. 8-26)
8-7 Tolerance and Prediction Intervals 8-7.1 Prediction Interval for Future Observation (Eq. 8-27) The prediction interval for Xn+1 will always be longer than the confidence interval for .
8-7 Tolerance and Prediction Intervals Example 8-9
8-7 Tolerance and Prediction Intervals 8-7.2 Tolerance Interval for a Normal Distribution Definition
8-7 Tolerance and Prediction Intervals Example 8-10
Important Terms & Concepts of Chapter 8 Chi-squared distribution Confidence coefficient Confidence interval Confidence interval for a: • Population proportion • Mean of a normal distribution • Variance of a normal distribution Confidence level Error in estimation Large sample confidence interval 1-sided confidence bounds Precision of parameter estimation Prediction interval Tolerance interval 2-sided confidence interval t distribution Chapter 8 Summary