Statistical Intervals for a Single Sample
Statistical Intervals for a Single Sample. Chapter 8. Construct confidence intervals on the mean of a normal distribution Construct confidence intervals on the variance and standard deviation of a normal distribution Construct confidence intervals on a population proportion.

Statistical Intervals for a Single Sample
E N D
Presentation Transcript
Statistical Intervalsfor a Single Sample Chapter 8
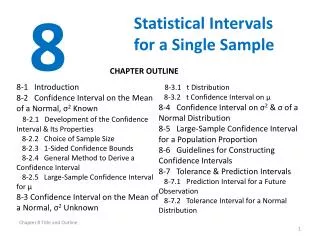
Construct confidence intervals on the mean of a normal distribution Construct confidence intervals on the variance and standard deviation of a normal distribution Construct confidence intervals on a population proportion LEARNING OBJECTIVES
Confidence Interval • Learned how a parameter can be estimated from sample data • Confidence interval construction and hypothesis testing are the two fundamental techniques of statistical inference • Use a sample from the full population to compute the point estimate and the interval
Confidence Interval On The Mean of a Normal Distribution, Variance Known • From sampling distribution, L and U P (L ≤ μ≤ U)= 1-α • Indicates probability of 1-α that CI will contain the true value of μ • After selecting the sampleand computingl and u, the CI for μ l ≤ μ≤ u • l and u are called the lower- and upper-confidence limits
Confidence Interval On The Mean of a Normal Distribution, Variance Known • Suppose X1, X2, , Xnis a random sample from a normal distribution • Z has a standard normal distribution • Writing zα/2 for the z-value • Hence • Multiplying each term • A 100(1-α )% CI on μ when variance is known 1- α zα/2 -zα/2
Example • A confidence interval estimate is desired for the gain in a circuit on a semiconductor device • Assume that gain is normally distributed with standard deviation of 20 • Find a 95% CI for μ when n=10 and • Find a 95% CI for μ when n=25 and • Find a 99% CI for μ when n=10 and • Find a 99% CI for μ when n=25 and
Example a) 95% CI for α=0.05, Z 0.05/2 =Z 0.025 = 1.96. Substituting the values Confidence interval b) 95% CI for c) 99% CI for d) 99% CI for
Choice of Sample Size • (1-α)100% C.I. provides an estimate • Most of the time, sample mean not equal to μ • Error E = • Choose n such that zα/2/√n = E • Solving for n • Results: n = [(Zα/2σ)/E]2 • 2E is the length of the resulting C.I.
Example • Consider the gain estimation problem in previous example • How large must n be if the length of the 95% CI is to be 40? • Solution • α =0.05, then Zα/2 = 1.96 • Find n for the length of the 95% CI to be 40
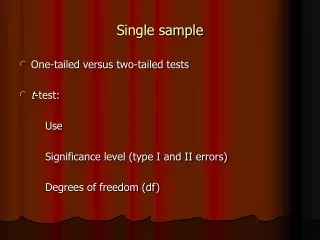
One-Sided Confidence Bounds • Two-sided CI gives both a lower and upper bound for μ • Also possible to obtain one-sided confidence bounds for μ • A 100(1-α )% lower-confidence bound for μ • A 100(1-α )% upper-confidence bound for μ
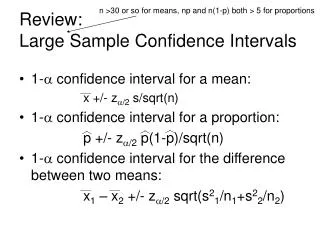
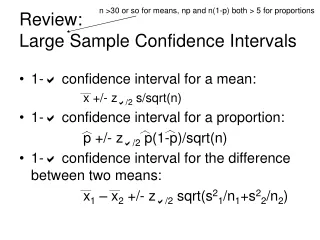
A Large-Sample Confidence Interval for μ • Assumed unknown μ and known • Large-sample CI • Normality cannot be assumed and n ≥ 40 • S replaces the unknown σ • Let X1, X2,…, Xnbe a random sample with unknown μ and 2 • Using CLT: • Normally distributed • A 100(1-α )% CI on μ:
C.I. on the Mean of a Normal Distribution, Variance Unknown • Sample is small and 2 is unknown • Wish to construct a two-sided CI on μ • When 2 is known, we used standard normal distribution, Z • When 2 is unknown and sample size ≥40 • Replace with sample standard deviation S • In case of normality assumption, small n, and unknown σ, Z becomes T=(X-μ)/(S/√n) • No difference when n is large
The t Distribution • Let X1, X2,..., Xnbe a random sample from a normal distribution with unknown μ and 2 • The random variable • Has a t-distribution with n-1 d.o.f • No. of d.o.f is the number of observation that can be chosen freely • Also called student’s t distribution • Similar in some respect to normal distribution • Flatter than standard normal distribution • =0 and 2=k/(k-2)
The t Distribution • Several t distributions • Similar to the standard normal distribution • Has heavier tails than the normal • Has more probability in the tails than the normal • As the number d.o.f approaches infinity, the t distribution becomes standard normal distribution
Table IV provides percentage points of the t distribution Let tα,kbe the value of the random variable T with k (d.o.f) Then, tα,kis an upper-tail 100α percentage point of the t distribution with k The t Distribution
The t Confidence Interval on μ • A 100(1-α ) % C.I. on the mean of a normal distribution with unknown 2 • tα/2,n-1 is the upper 100α/2 percentage point of the t distribution with n-1 d.o.f
Example • An Izod impact test was performed on 20 specimens of PVC pipe • The sample mean is 1.25 and the sample standard deviation is s=0.25 • Find a 99% lower confidence bound on Izod impact strength
Solution • Find the value of tα/2,n-1 • α=0.01and n=20, then the value of tα/2,n-1 =2.878
Chi-square Distribution • Sometimes C.I. on the population variance is needed • Basis of constructing this C.I. • Let X1, X2,..,Xnbe a random sample from a normal distribution with μ and 2 • Let S2 be the sample variance • Then the random variable: • Has a chi-square (X2) distribution with n-1 d.o.f.
Shape of Chi-square Distribution • The mean and variance of the X2 are k and 2k • Several chi-square distributions • The probability distribution is skewed to the right • As the k→∞, the limiting form of the X2 is the normal distribution
Percentage Points of Chi-square Distribution • Table III provides percentage points of X2 distribution • Let X2α,kbe the value of the random variable X2with k (d.o.f) • Then, X2α,k
C.I. on the Variance of A Normal Population • A 100(1-α)% C.I. on 2 • X2 α/2,n-1 and X2 1-α/2,n-1 are the upper and lower 100α/2 percentage points of the chi-square distribution with n-1 degrees of freedom
One-sided C.I. • A 100(1 )% lower confidence bound or upper confidence bound on 2
Example • A rivet is to be inserted into a hole. A random sample of n=15 parts is selected, and the hole diameter is measured • The sample standard deviation of the hole diameter measurements is s=0.008 millimeters • Construct a 99% lower confidence bound for 2 • Solution • For = 0.01 and X20.01, 14 =29.14
A Large Sample C.I. For APopulation Proportion • Interested to construct confidence intervals on a population proportion • =X/n is a point estimator of the proportion • Learned if p is not close to 1 or 0 and if n is relatively large • Sampling distribution of is approximately normal • If n is large, the distribution of • Approximately standard normal
Confidence Interval on p • Approximate 100 (1-α) % C.I. on the proportion p of the population where zα/2 is the upper α/2 percentage point of the standard normal distribution • Choice of sample size • Define the error in estimating p by • E= • 100(1-α)% confident that this error less than • Thus n = (Zα/2/E)2p(1-p)
Example • Of 1000 randomly selected cases of lung cancer, 823 resulted in death within 10 years • Construct a 95% two-sided confidence interval on the death rate from lung cancer • Solution • 95% Confidence Interval on the death rate from lung cancer
Example • How large a sample would be required in previous example to be at least 95% confident that the error in estimating the 10-year death rate from lung cancer is less than 0.03? • Solution • E = 0.03, = 0.05, z/2 = z0.025 = 1.96 and = 0.823 as the initial estimate of p