Project Progress and Cost Analysis: Earned Value Management
Understand the basics of Earned Value Management in project management, with explanations, calculations, and progress indicators. Learn about visibility, different project approaches, and productivity calculation. Dive into project analysis and tracking.

Project Progress and Cost Analysis: Earned Value Management
E N D
Presentation Transcript
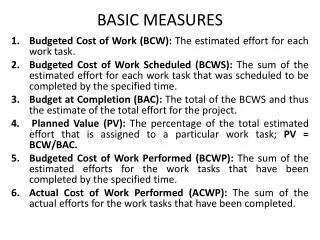
BASIC MEASURES • Budgeted Cost of Work (BCW): The estimated effort for each work task. • Budgeted Cost of Work Scheduled (BCWS): The sum of the estimated effort for each work task that was scheduled to be completed by the specified time. • Budget at Completion (BAC): The total of the BCWS and thus the estimate of the total effort for the project. • Planned Value (PV): The percentage of the total estimated effort that is assigned to a particular work task; PV = BCW/BAC. • Budgeted Cost of Work Performed (BCWP): The sum of the estimated efforts for the work tasks that have been completed by the specified time. • Actual Cost of Work Performed (ACWP): The sum of the actual efforts for the work tasks that have been completed.
PROGRESS INDICATORS Earned Value (EV) = BCWP/BAC = The sum of the PVs for all completed work tasks = PC = Percent complete Schedule Performance Index(SPI)=BCWP/BCWS Schedule Variance (SV) = BCWP-BCWS Cost Performance Index(CPI) = BCWP/ACWP Cost Variance (CV) = BCWP - ACWP
Company LMN is partway through its project. The job log below indicates thecurrent status of the project.
Answer The BAC is the sum of the estimations. BAC = 330 days. BAC is an estimate of the total work. On 4/1/01, tasks 1,2, and 4 have been completed. The BCWP is the sum of the BCWS for those tasks. So BCWP is 70 days. The earned value (EV) is 70/330, or 21.2 percent. On 4/1/01 tasks 1 and 2 were scheduled to be completed and 1,2, and 4 were actually completed. So BCWP is 70 days and BCWS is 30 days. Thus, SPI is 70/30, or 233 percent. The SV = 70 days 30 days = +40 days, or 40 programmer-days ahead. The ACWP is the sum of actual effort for tasks 1, 2, and 4. So, ACWP is 80 programmer-days. CPI is 70/80 = 87.5 percent. The CV= 70 programmer-days 80 programmer-days = 10 programmer-days, or 10 programmer-days behind.
1. What is meant by visibility? Visibility is the attribute of being able to see the progress or lack of progress in a project. 2. What is the difference between a process approach and a project approach? A process approach is similar to an assembly line, where each person has a task to be done. Developers may do the same task on multiple projects—for example, a test team or a design team. A project emphasis would give the team the responsibility for the whole effort in developing a project. 3. For a new project that is very different from any previous project, would a process or project management approach be better? Process management works well with projects that are well understood. A new, very different project might be better managed by a project approach that emphasizes success in the project.
Using the following time log, calculate the programmer’s productivity in LOC/day.Assume that project 1 was 120 LOC and project 2 was 80 LOC.
The delta time for day 1 is 8 hours 1 hour for lunch = 420 minutes; day 2 is 8 hours30 minutes=450 minutes. So the productivity for project 1 is 120 LOC/ 870 minutes= 120 LOC/ 2.175 days = 55 LOC/programmer-day (assume 400 minutes per programmer day). The delta times for day 3 and 4 are 7 hours and 4.5 hours = 690 minutes. The productivity is 80 LOC/ 1.725 days = 46.4 LOC/programmer-day. Overall, the programmer averaged 200 LOC/ 3.9 days = 51.3 LOC/programmer-day.
The BCWS is 50+35+20+40=145 programmer-days. The BAC is 50+35+20+40+60+80=285 programmer-days. • The planned values (PVs) for the work tasks are 17.5 percent, 12.3 percent, 7.0 percent, 14.0 percent, 21.1 percent, 28.1 percent. • The earned value is 17.5 percent + 12.3 percent + 7 percent + 14 percent= 50.7 percent. • The BCWP for 5/01/01 is the same as BCWS in this example because the scheduled work has been completed. • Thus, SPI=145/145=1.
6. The schedule variance is 145 145=0. The cost performance index= 145 /170 = 85.3 percent. This indicates that the actual effort is larger than the estimated effort. 7. The cost variance is 145 170=25. This also indicates that more effort has been required than was estimated. 8. The project appears to be on schedule but is costing more than was planned.
Use a spreadsheet to calculate the PV and the progress indicators for the followingproject at half-month intervals from January 1 through September 1.
A professor has 40 homework assignments and 40 exams to grade. The exams usually take 3 times as long to grade as the homework assignments. • Calculate the PV for each homework and for each exam. • After 5 hours, if the professor has half of the exams done, how long should he estimate it will take to complete the grading?
Assume a grading unit is equal to 1 homework assignment. Then this task has a total of 40 1 þ 40 3 ¼ 160 grading units. Each homework has a planned value of 1/160 = 0.625 percent, and each exam has a planned value of 1.875 percent. After 5 hours, 20 exams are completed, or 37.5 percent. Thus, 5/0.375= 13.33 hours as the estimated total time, or 8.33 hours left.
The project started on January 1 and should be finished by June 1. It is now March 1. Complete the following table. Calculate EV, SPI, SV, and CV. Determine whether the project is on time. Justify your answer. Show your work.
BAC = 20 • BCWS = 50 • BCWP = 70 • ACWP = 60 • EV =70/200= 0:35 • SV = 70 - 50 =20 • SPI= 70/50=1.4 • CV= 70-60=10 The project is ahead of schedule.
WBS—Work Breakdown Structure The work breakdown structure (WBS) should be a tree structure. The top-level breakdown usually matches the life cycle model (LCM) used in the organization. The next-level breakdown can match the processes in the organization’s process model (PM). Further levels are used to partition the task into smaller, more manageable tasks. The following are rules for constructing a proper work breakdown structure: 1.The WBS must be a tree structure. There should be no loops or cycles in the WBS. Iterative actions will be shown in the process model and/or the life cycle model. 2. Every task and deliverable description must be understandable and unambiguous. The purpose of a WBS is communication with team members. If the team members misinterpret what the task or deliverable is supposed to be, there will be problems.
3.Every task must have a completion criterion (often a deliverable). There must be a way to decide when a task is completed, because subtasks that have no definite ending encourage false expectations of progress. This decision is called a completion criterion. It may be a deliverable, for example, a complete design for the project, and then a peer review can decide if it is complete. 4. All deliverables (artifacts) must be identified. A deliverable must be produced by some task or it won’t be produced. 5. Positive completion of the tasks must imply completion of the whole task. The purpose of the work breakdown schedule is to identify the subtasks necessary to complete the whole task. If important tasks or deliverables are missing, the whole task will not be accomplished.
Software Cost Estimation The task of software cost estimation is to determine how many resources are needed to complete the project. Usually this estimate is in programmer-months (PM). There are two very different approaches to cost estimation. The older approach is called LOC estimation, since it is based on initially estimating the number of lines of code that will need to be developed for the project. The newer approach is based on counting function points in the project description.
ESTIMATION OF LINES OF CODE (LOC) The first step in LOC-based estimation is to estimate the number of lines of code in the finished project. This can be done based on • experience, • size of previous projects, • size of a competitor’s solution, or • by breaking down the project into smaller pieces and • then estimating the size of each of the smaller pieces. standard approach is, for each piece, to estimate the • maximum possible size, max, • the minimum possible size, mini, and • the ‘‘best guess’’ size, best. The estimate for the whole project is 1/6 of the sum of the maximums, the minimums, and 4 times the best guess:
Team WRT had identified seven sub pieces to their project. These are shown inTable with their estimates of the size of each sub piece. Subpiece Size Estimate (in LOC)
The estimates for each section are as follows: • P(20 + 4* 30+ 50)/6 = 190/6= 31.6 • P2(10+ 4*15 +25)/6 =95/6 = 15.8 • P3(25+4*30+45)/6= 190/6=31.6 • P4(30+4*35+40)/6=220/6=36.7 • P5(15 +4*20 +25)/6=120/6=20 • P6(10 + 4*12+14)=72/6=12 • P7(20+4*22+25)=133/6= 22.17
The estimate for the whole project is the sum of the estimates for each section:
LOC-BASED COST ESTIMATION The basic LOC approach is a formula that matches the historical data. The basic formula has three parameters: Alpha, , is the marginal cost per KLOC (thousand lines of code). This is the added cost for an additional thousand lines of code. The parameter beta, , is an exponent that reflects the nonlinearity of the relationship. A value of beta greater than 1 means that the cost per KLOC increases as the size of the project increases. This is a diseconomy of scale. A value of beta less than 1 reflects an economy of scale. Some studies have found betas greater than 1, and other studies have betas less than 1. The parameter gamma, , reflects the fixed cost of doing any project. Studies have found both positive gammas and zero gammas.
CONSTRUCTIVE COST MODEL (COCOMO) COCOMO is the classic LOC cost-estimation formula. It was created by Barry Boehm in the 1970s. He used thousand delivered source instructions (KDSI) as his unit of size. KLOC is equivalent. His unit of effort is the programmer-month (PM). Boehm divided the historical project data into three types of projects: • Application (separate, organic, e.g., data processing, scientific) • Utility programs (semidetached, e.g., compilers, linkers, analyzers) • System programs (embedded)
Calculate the programmer effort for projects from 5 to 50 KDSI
The following are the formulas for development time (TDEV) in programmer-months: 1. Application programs: TDEV= 2.5*(PM)0.38 2. Utility programs: TDEV= 2.5*(PM)0.35 3. Systems programs: TDEV=2.5(PM)0.32
Calculate the standard TDEV using the COCOMO formulas for projects from 5 to 50 KDSI
FUNCTION POINT ANALYSIS The idea of function points is to identify and quantify the functionality required for the project. The idea is to count things in the external behavior that will require processing. The classic items to count are as follows: • Inputs • Outputs • Inquiries • Internal files • External interfaces
Inquiries are request-response pairs that do not change the internal data. For example, a request for the address of a specified employee is an inquiry. The whole sequence of asking, supplying the name, and getting the address would count as one inquiry.
Inputs are items of application data that is supplied to the program. The logical input is usually considered one item and individual fields are not usually counted separately. For example, the input of personal data for an employee might be considered one input.
Outputs are displays of application data. This could be a report, a screen display, or an error message. Again, individual fields are usually not considered separate outputs. If the report has multiple lines, for instance, a line for each employee in the department, these lines would all be counted as one output. However, some authorities would count summary lines as separate outputs.
Internal files are the logical files that the customer understands must be maintained by the system. If an actual file contained 1000 entries of personnel data, it would probably be counted as one file. However, if the file contained personnel data, department summary data, and other department data, it would probably be counted as three separate files for the purposes of counting function points.
External interfaces are data that is shared with other programs. For example, the personnel file might be used by human resources for promotion and for payroll. Thus, it would be considered an interface in both systems.
PRODUCTIVITY One of the important measures is the productivity of the software developers. This is determined by dividing the total size of the finished product by the total effort of all the programmers. This has units of LOC/programmer-day. An alternative is to measure the productivity in terms of function points per programmer-day.